Select your product to confirm this information applies to you
TüN® 4 and MAX™: Taking Electrical and Impedance Measurements
TüN® 4 and MAX™ create a very powerful combination of tightly integrated software and hardware for taking electrical measurements. With MAX™, you can measure many types of signals, which is useful for OEM integration, system tuning, troubleshooting, testing speakers, and far more.Time to jump into MAX™ and its suite of different inputs and outputs.
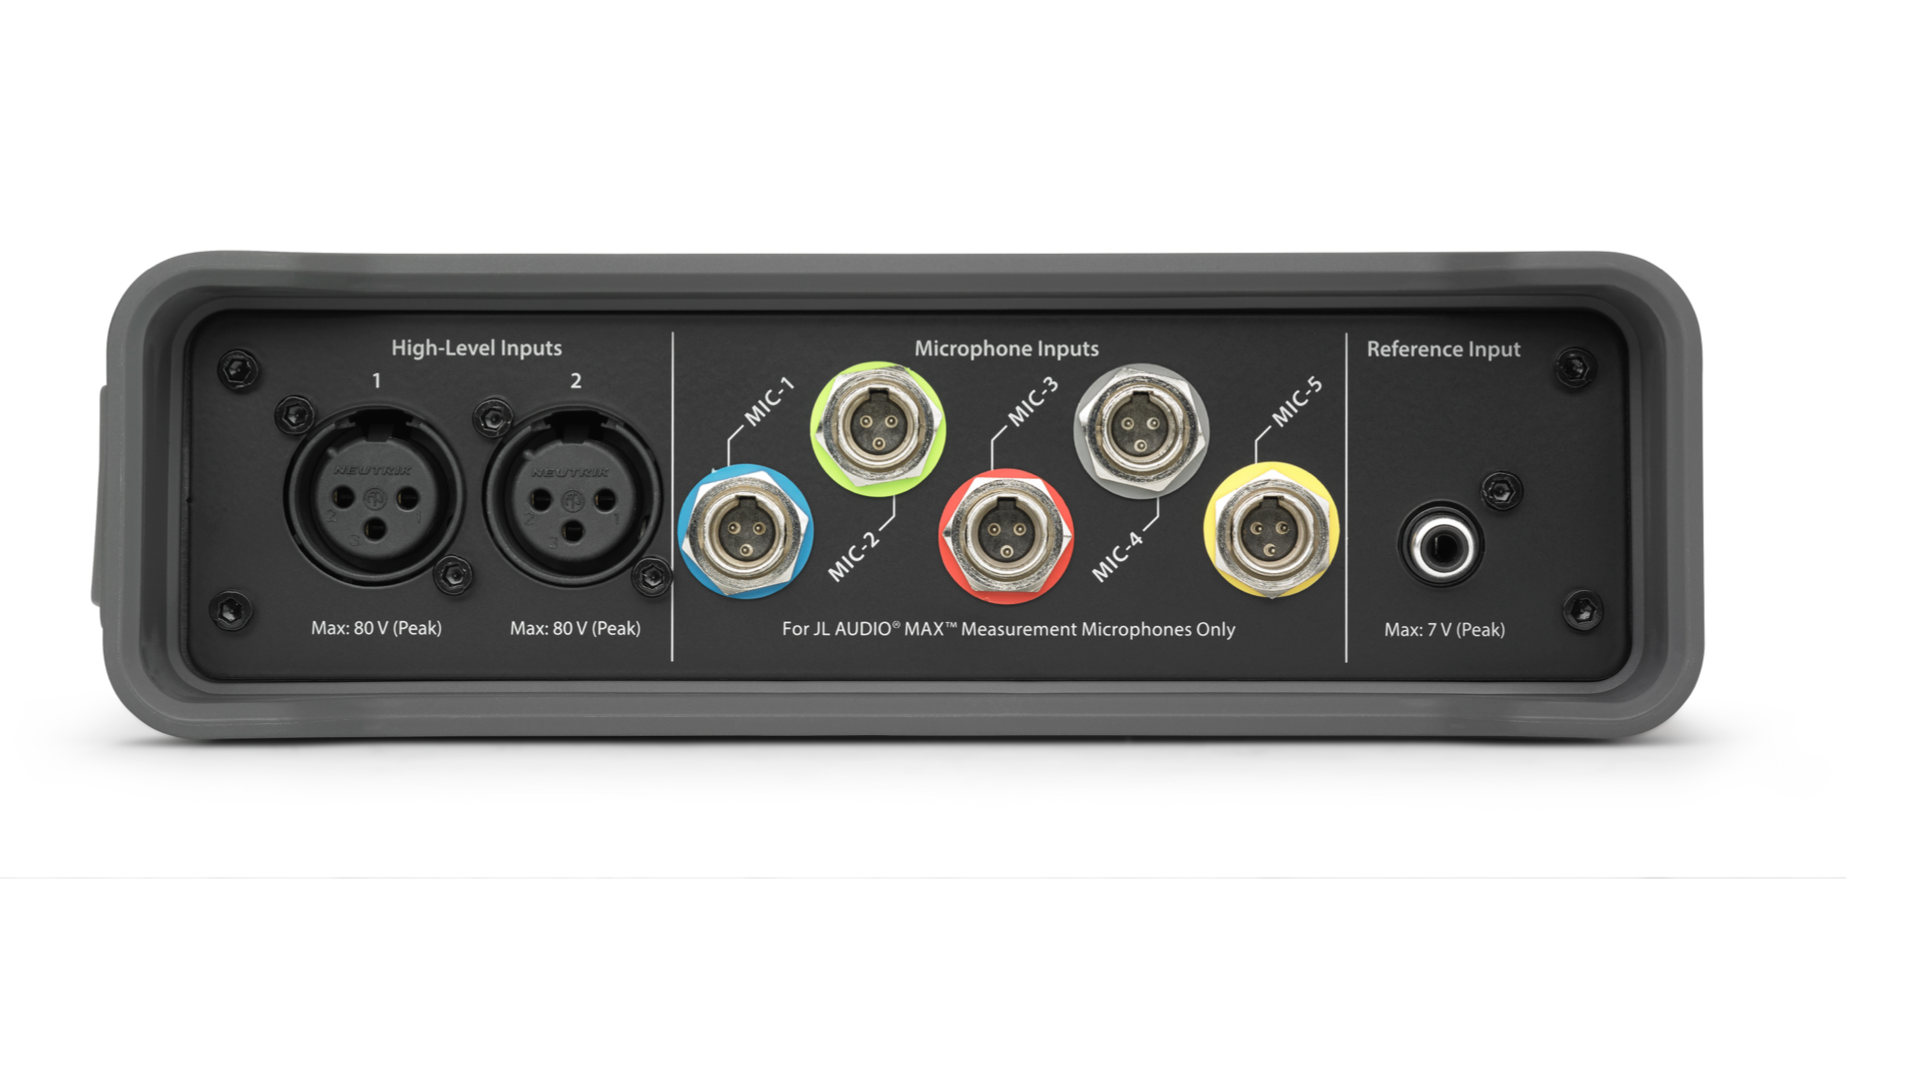
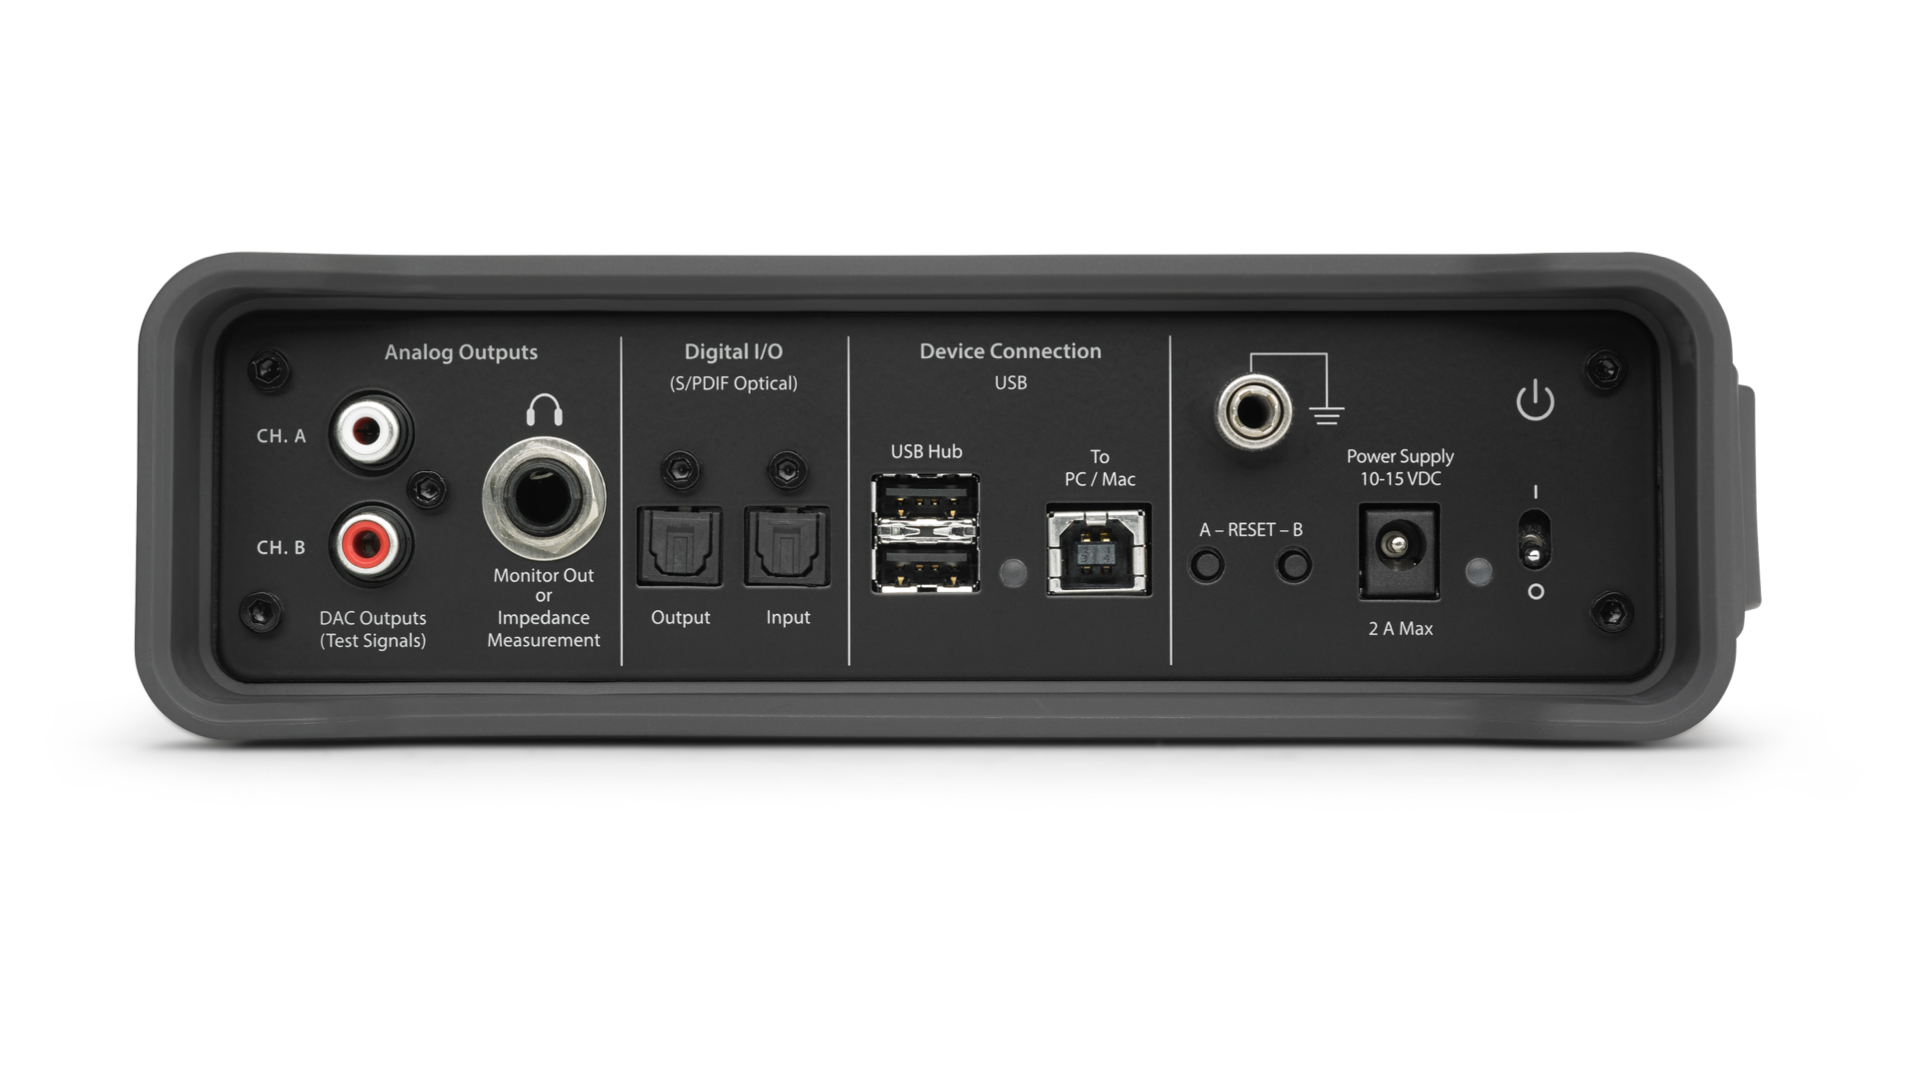
MAX™ has a combined 10 audio inputs for taking a multitude of different measurements.
High-Level Inputs: These inputs are capable of up to 80 volts AC input and safe for up to 50 volts of DC.They provide the ability to measure large class D amplifiers without worry about damaging MAX™
Microphone Inputs: These inputs are optimized for use with the MAX™ microphones that are included with the MAX-KIT.
Reference Input: This input is safe for up to 7 volts AC (peak) and is optimized for low level signal.
Digital Inputs : Accepts Linear PCM, 2.0-channel. S/PDIF digital audio signals with sample rates up to 192kHz. Toslink Optical Connection.
Digital Outputs : Outputs Linear PCM, 2.0-channel S/PDIF signals from TüN™ with sample rates up to 96kHz. Hardware limit is 192kHz. Toslink Optical Connection.
DAC Outputs : 2 Channel unbalanced outputs with RCA type jacks
Monitor Out or Impedance Measurement : This connection does double duty.The TRS connector is an analog output that receives signal from the High-Level Inputs. This creates the ability to monitor the signal being measured on the High-Level Inputs. This is helpful when measuring OEM signals because it allows the user to monitor the signals for door chimes, navigation prompts, and other types of alerts using headphones. It can be used to monitor high powered amplifier outputs for audible noise at high volume levels because it has 60dB of adjustable level. This connection is also used for measuring Impedance of speakers and other devices. When TF1 Impedance Mode in the Measure Settings is engaged, the TRS output will be internally disconnected from the High-Level Inputs and be connected to the internal amplifier. It can send signal out while also measuring the impedance of whatever it is connected to.
USB Hub : MAX™ has a USB hub built in. (Up to 500 mA to power computer peripherals. NOT intended for charging mobile devices.) When used in combination with JL Audio DSPs, connect the device directly to the USB hub on MAX™ and connect one USB cable from MAX™ to the computer.It is recommended to never use the USB hub to power any devices such as mice, keyboards, or anything that will demand an excess amount of power through the USB.
Ground Lug : MAX™ has a ground lug that can be used if a system exhibits excess noise.This can be connected to an amplifier ground or vehicle chassis to reduce or eliminate audible noise or noise in your measured data.
There is a small LED next to the USB connector that displays the state of communication with the computer. LED Off means there is no connection with a host computer. Green LED means there is a connection to the host computer. Alternating blue and green LEDs means there is communication with TüN™ software.JL Audio offers an electrical probe set that can be purchased, SKU #90922. It comes with
XLR and TRS test leads with banana clips. It also has a set of high-quality test probes and an alligator clip for ground. It comes with a 10 Ohm resistor for calibrating TüN® software for impedance measurements. These documents can be referenced for building these parts instead of purchasing them from JL Audio: MAX™: D.I.Y. TRS Probe Instructions.
There are two buttons that are used for resetting MAX™. There is a power supply port, and a switch to power MAX™ on and off. There is also a small LED next to the power switch to let you know the status of MAX™.Green means ON.
There are several ways to measure electrical signal with the JL Audio MAX Measurement System. In this article, the test vehicle is a 2018 Chevrolet Silverado base model. As of this article, there are no pre-amp solutions available, and this customer wants to retain their OEM radio.
Using post-amplified signal as a source is never an ideal solution, in fact it is considered a compromise however sometimes it is the only option. There are several tools that can be used to accept and send low voltage signal out like a JL Audio LoC-22 or a FiX™ OEM Integration DSP. It is a good idea to measure the signal from the source unit before planning the system whenever possible.
Start by connecting the RCA outputs of MAX™ to an RCA to headphone (3mm) adapter and plug that into the vehicle’s aux input. Next, connect an XLR probe to High-Level Input 1 and connect the positive and negative leads to the front left speaker output. The green should be either unused or connected to ground. Make sure Pink Periodic Noise is selected on the signal generator and press play.
Note: Not all vehicles have an auxiliary input and some GM vehicles have an auxiliary input that doesn't function normally and skews the data. In this case, please read TüN® 4 & MAX™: Preparing to Tune with MAX™ - No Auxiliary Input? No Problem..
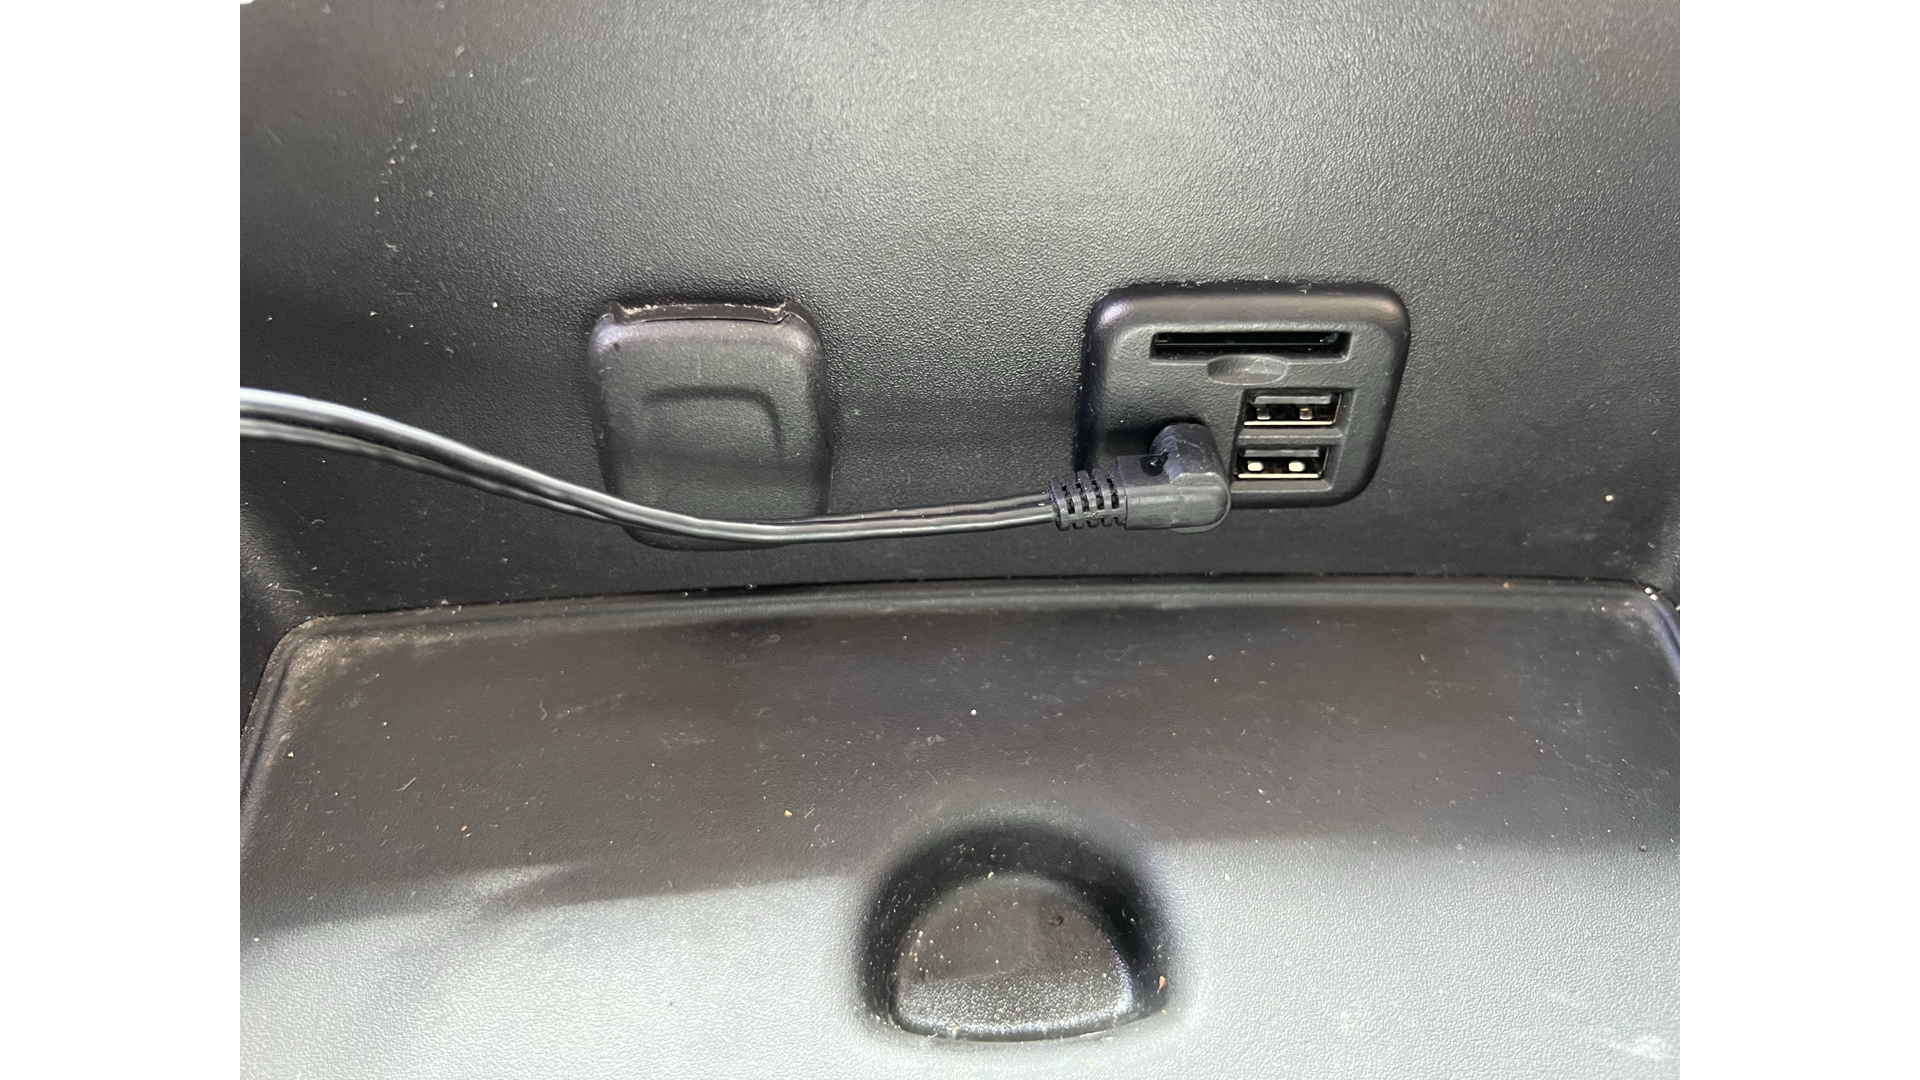
Image shows signal from JL Audio MAX™ connected to input of source unit
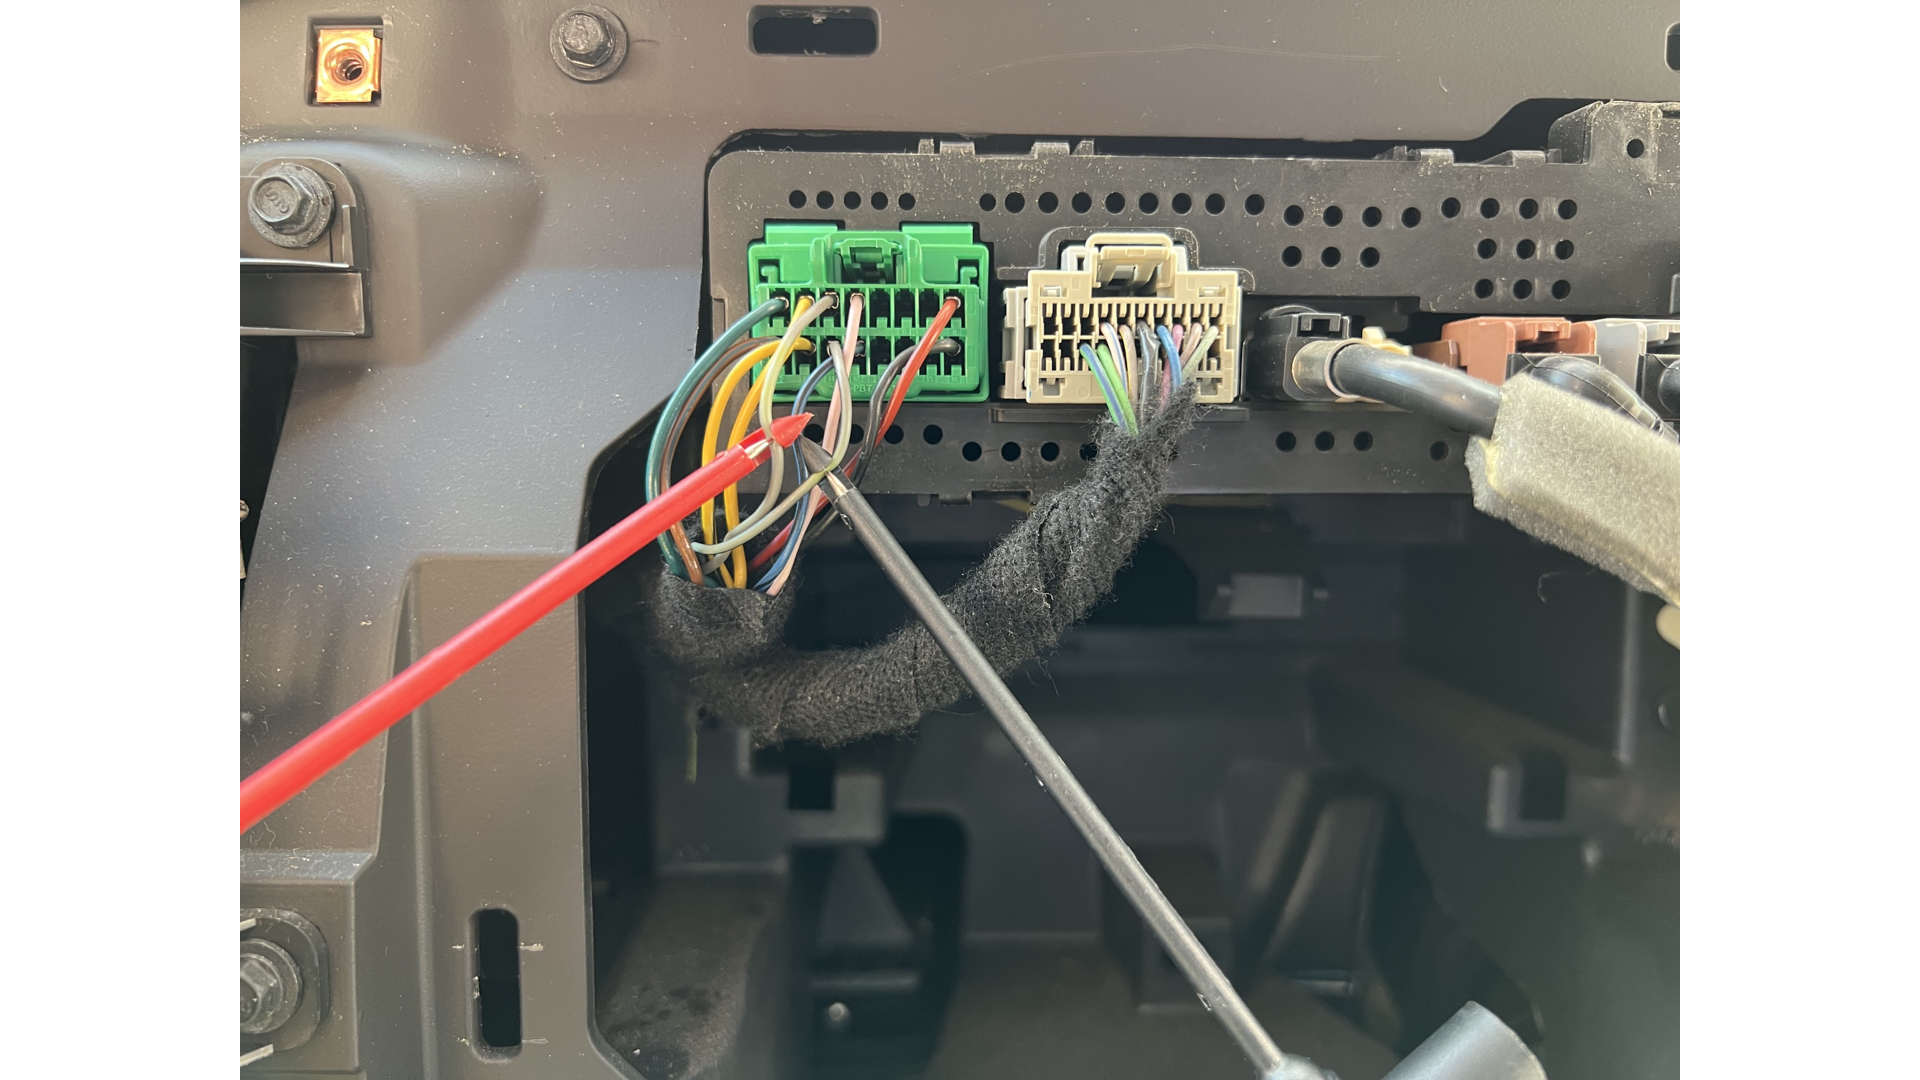
Image shows test probes connected to Front Left Channel of source unit
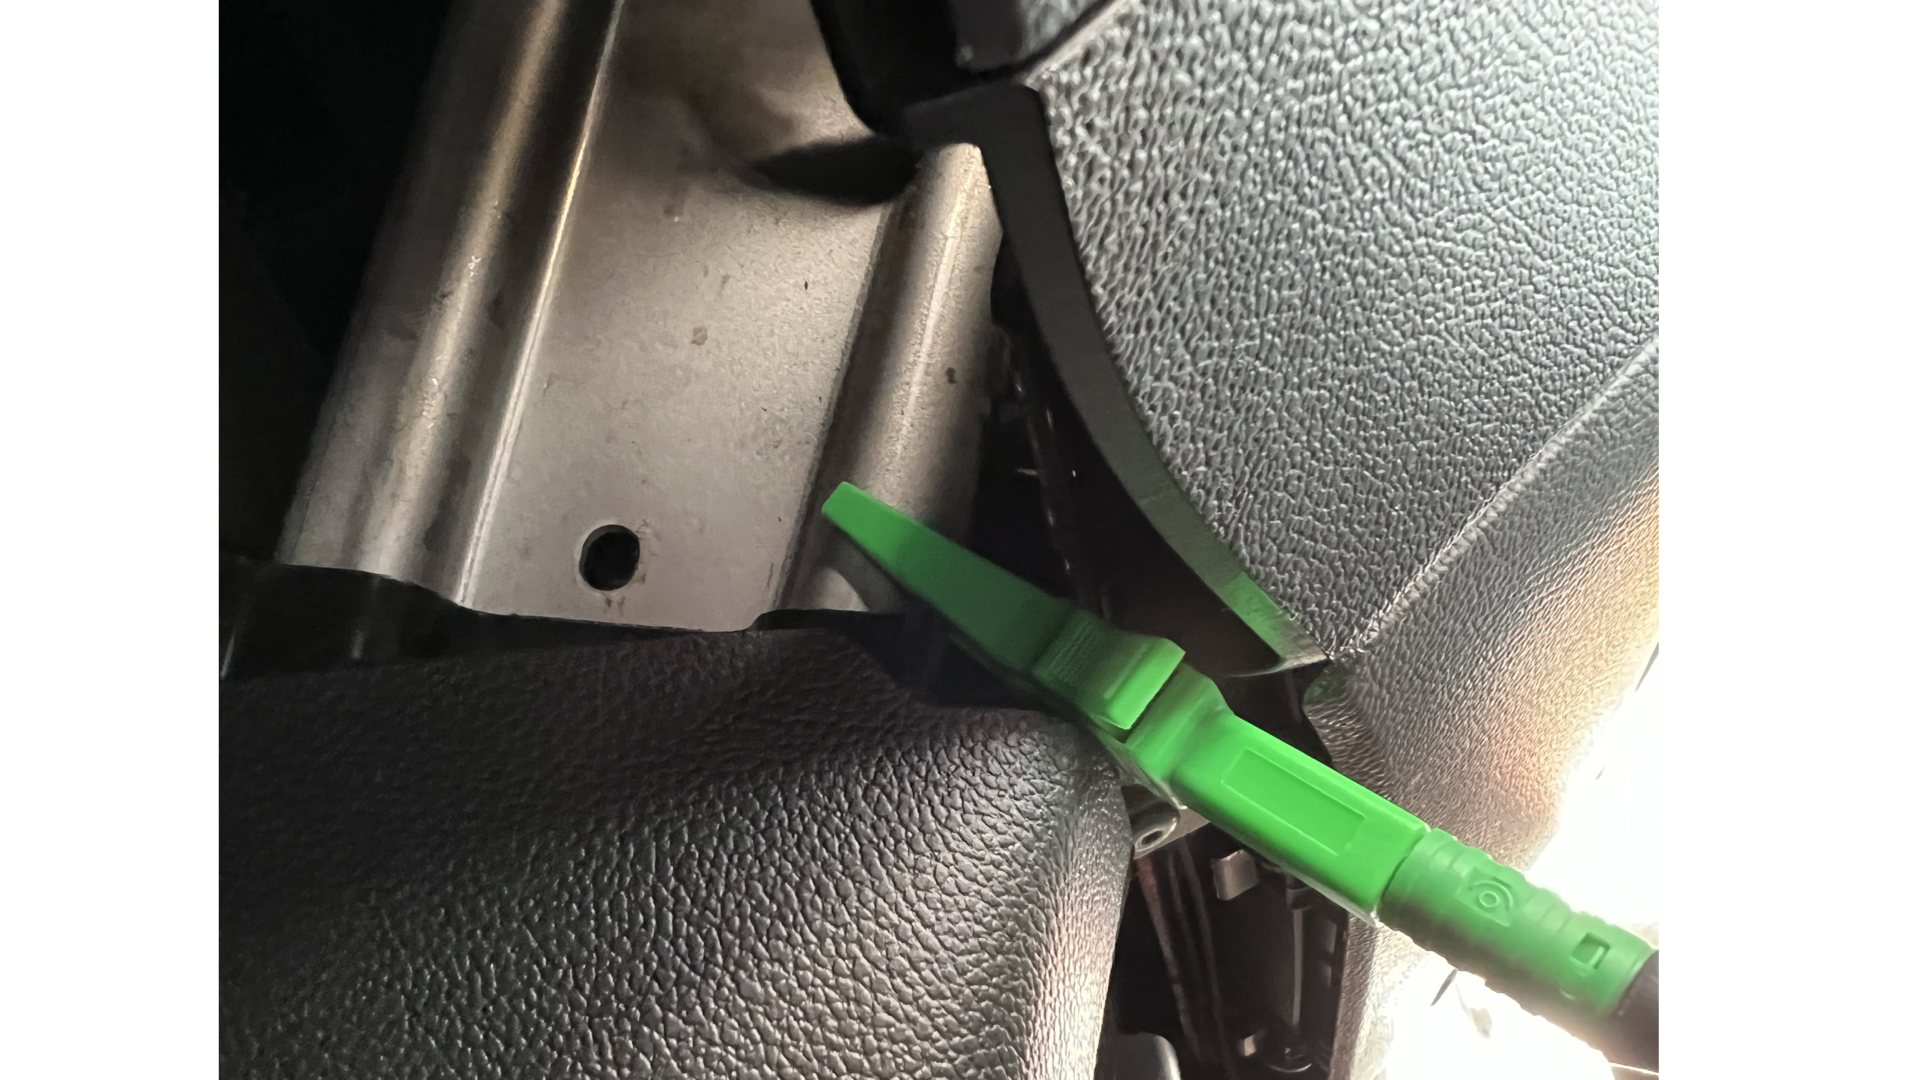
Image shows XLR ground probe connected to vehicle chassis ground
There are several things that can and should be measured from this signal. Beginning with viewing the electrical frequency response on the RTA to determine if there is any equalization from the factory radio or amplifier. In TüN™ software, select the Hi-Lev 1 input from the Input Combo Box on the RTA to view the response. Capture the data and name it appropriately. Switch to the Front Right channel to measure that side.
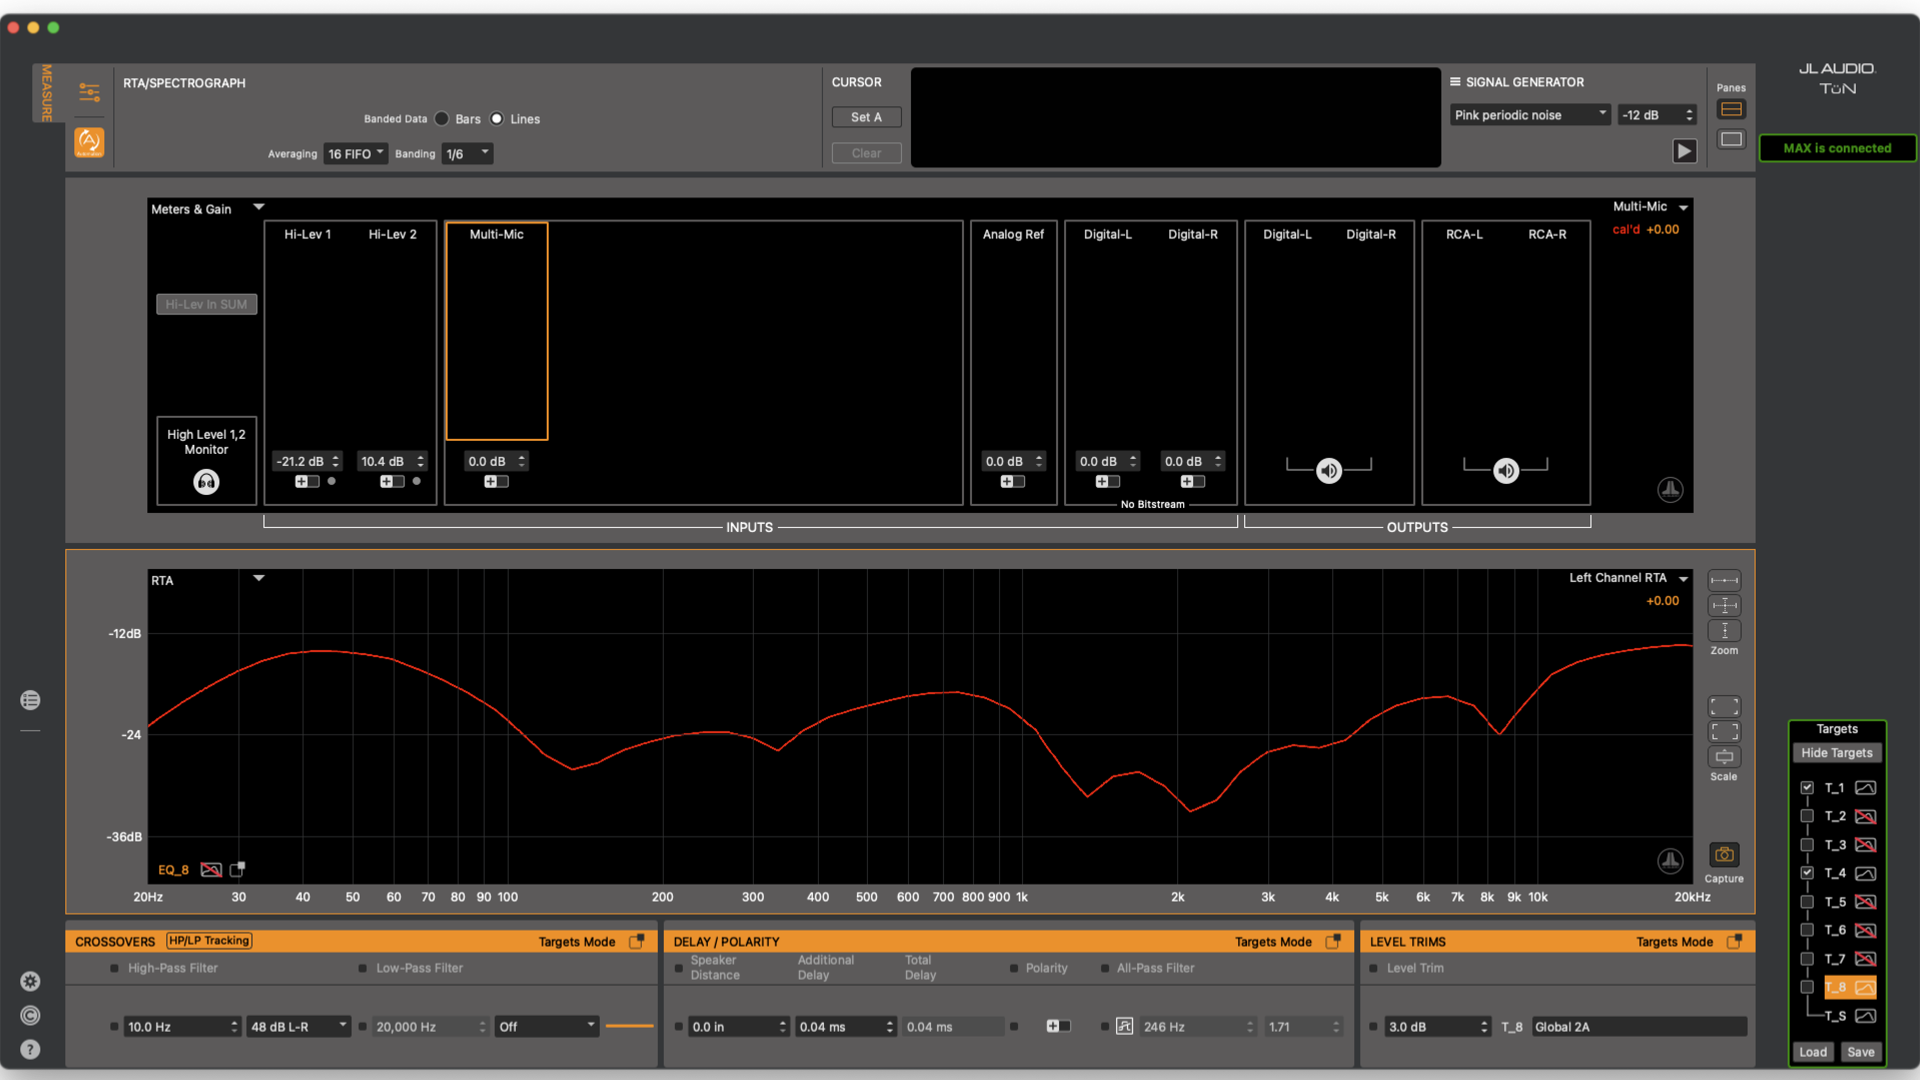
Image shows Front Left Channel frequency response on the RTA
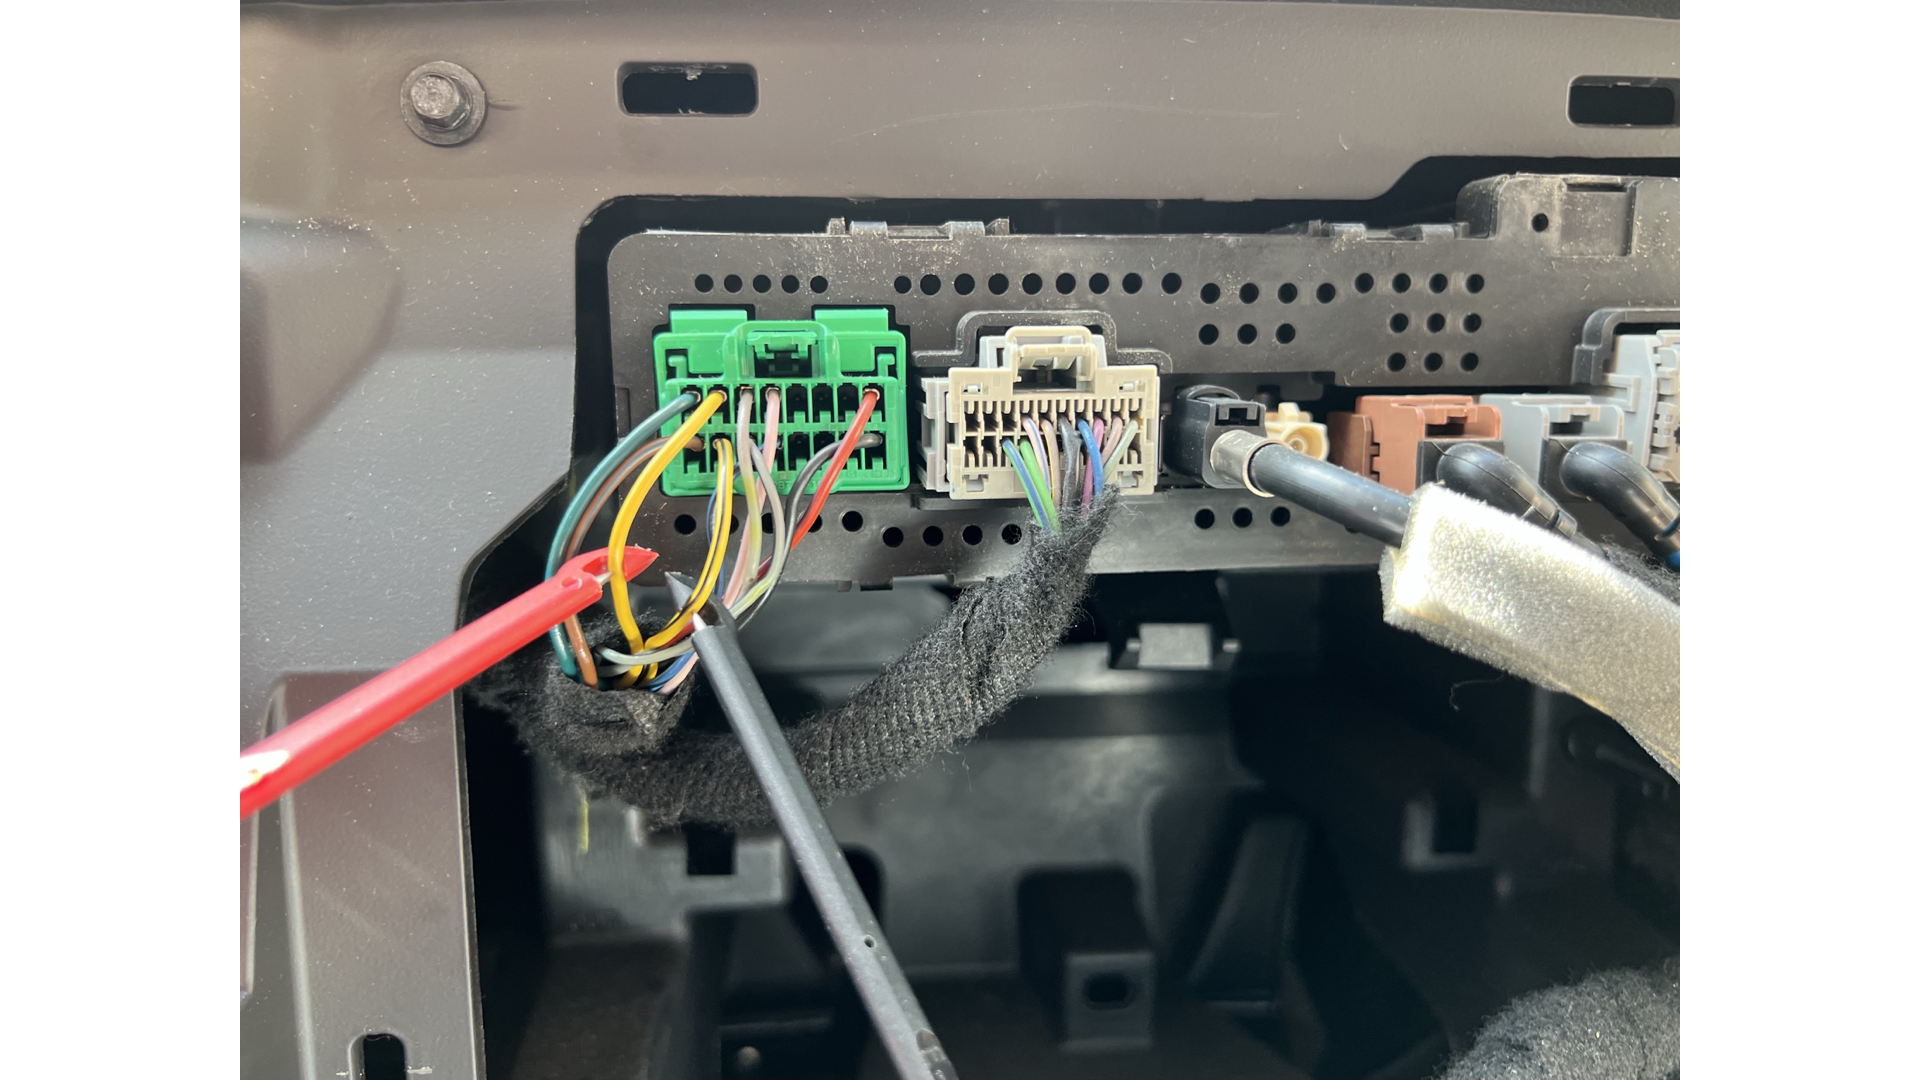
Image shows test probes connected to Front Right Channel of source unit
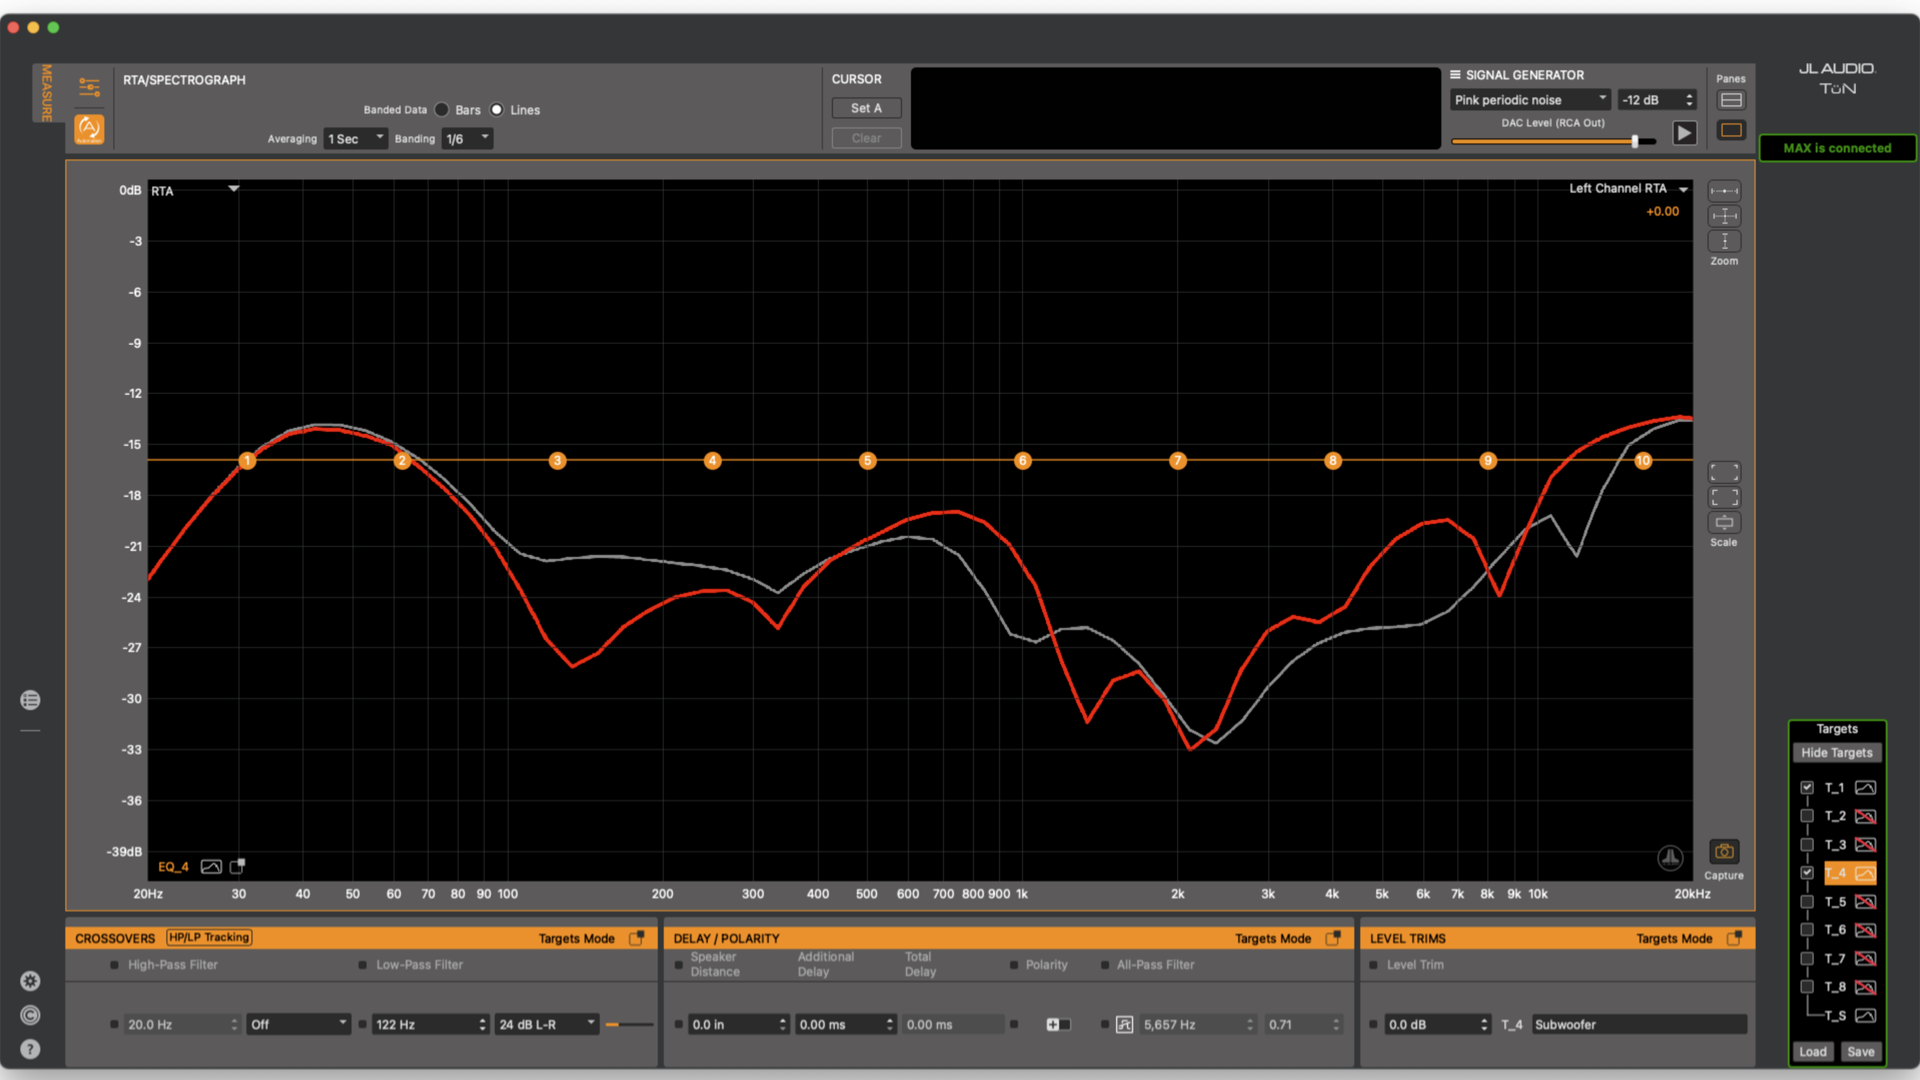
Image shows Front Left vs Front Right Channels on RTA
In order to view time domain information, a transfer function engine must be routed in the Measurement Setup tab. Using TF1 or any open TF Engine, the Measure channel should be connected to High-Level Input 1 and the Reference should be connected to the Internal Loopback. With TF1 routed, it is possible to measure the Impulse Response and find out how much time has passed from when signal was sent out of the MAX™ RCA outputs and when the signal arrived back into MAX™ via the High Level Input.
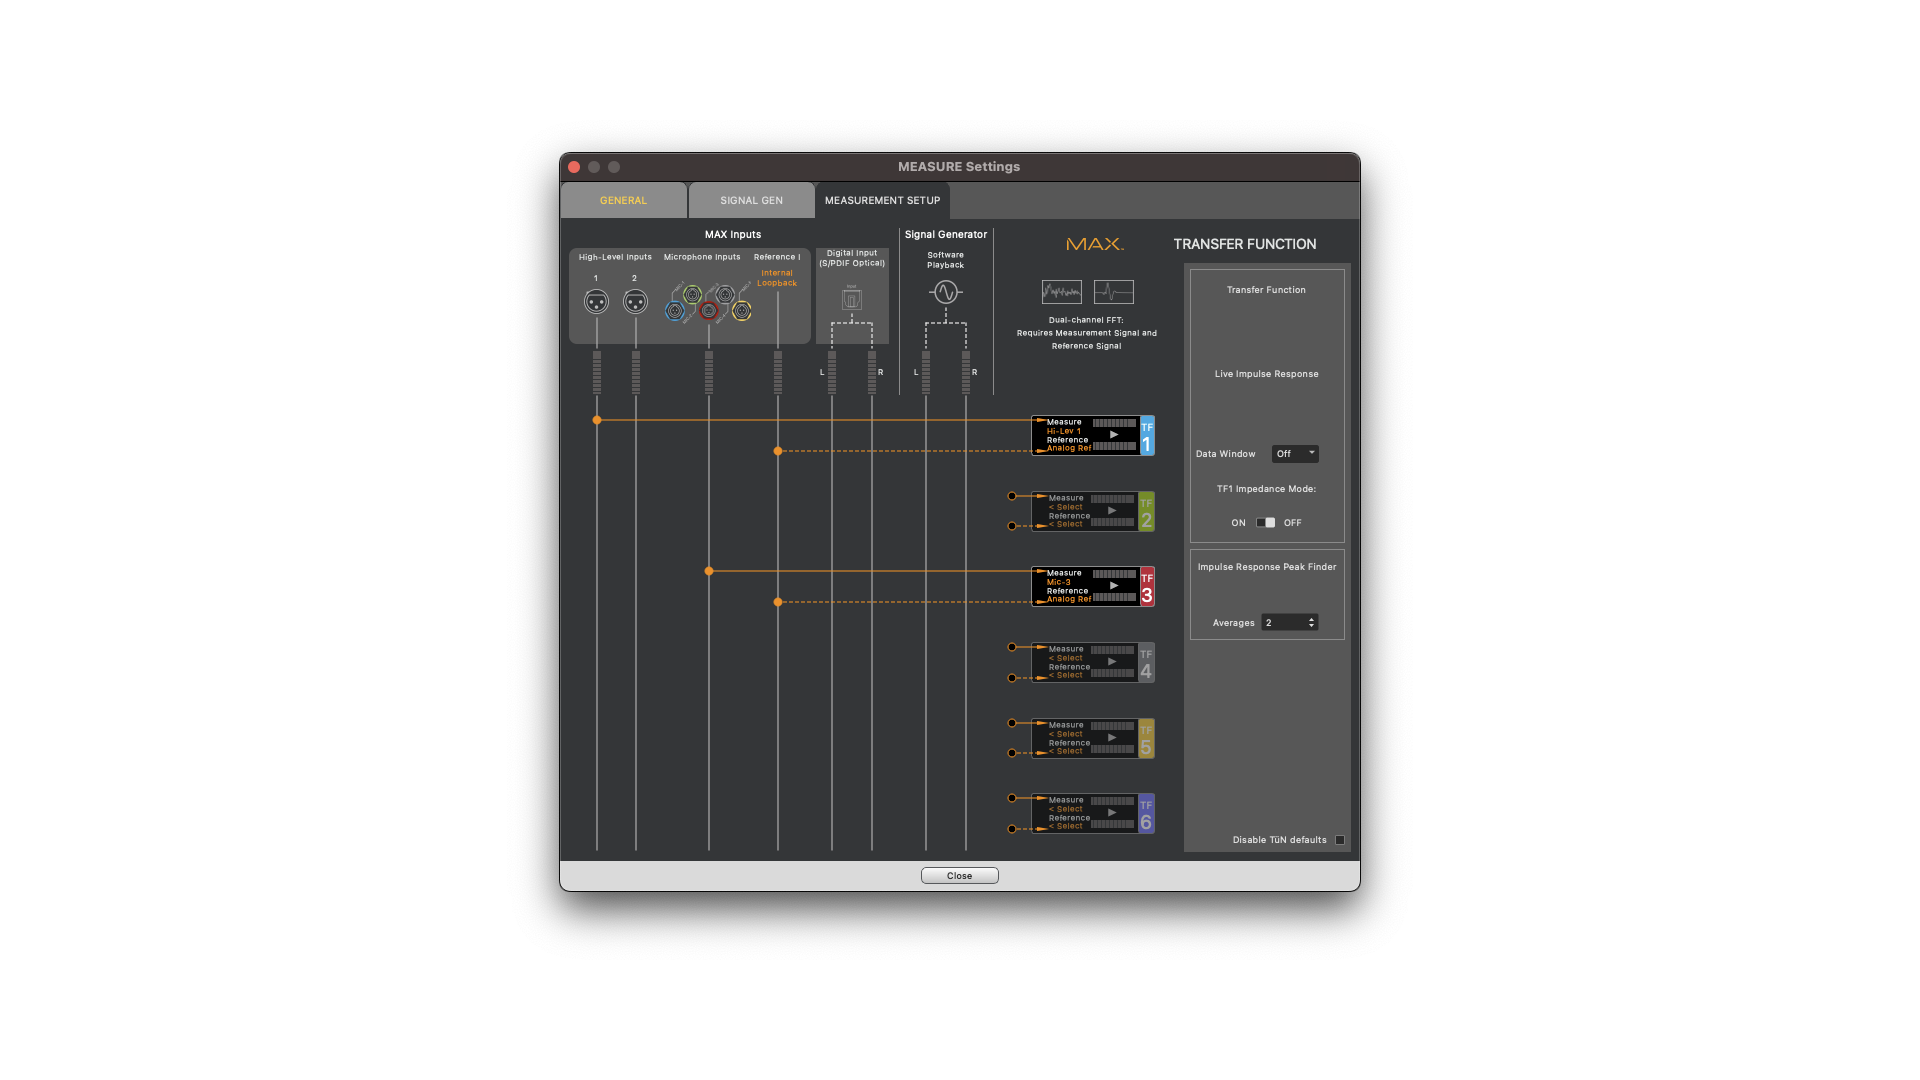
Image shows Transfer Function Engine 1 routed for measuring signal from High Level Input 1
When measuring the time domain, there are two things to look for: delay and all-pass filters. Since the human brain doesn’t process the delay or phase response of a single speaker, this only is relevant when comparing to another channel. The beginning of the impulse response will show up somewhere to the right of the 0.00 in the center of the graph by default. Zoom into the beginning of the impulse response and right click on the beginning to set the reference delay. The arrival time of that channel will now move to the center of the graph and become the reference delay replacing the 0.00 that was the default Reference Delay. The initial direction of that impulse response determines the relative polarity. Initial direction upward would be normal polarity and downward would be reverse polarity.
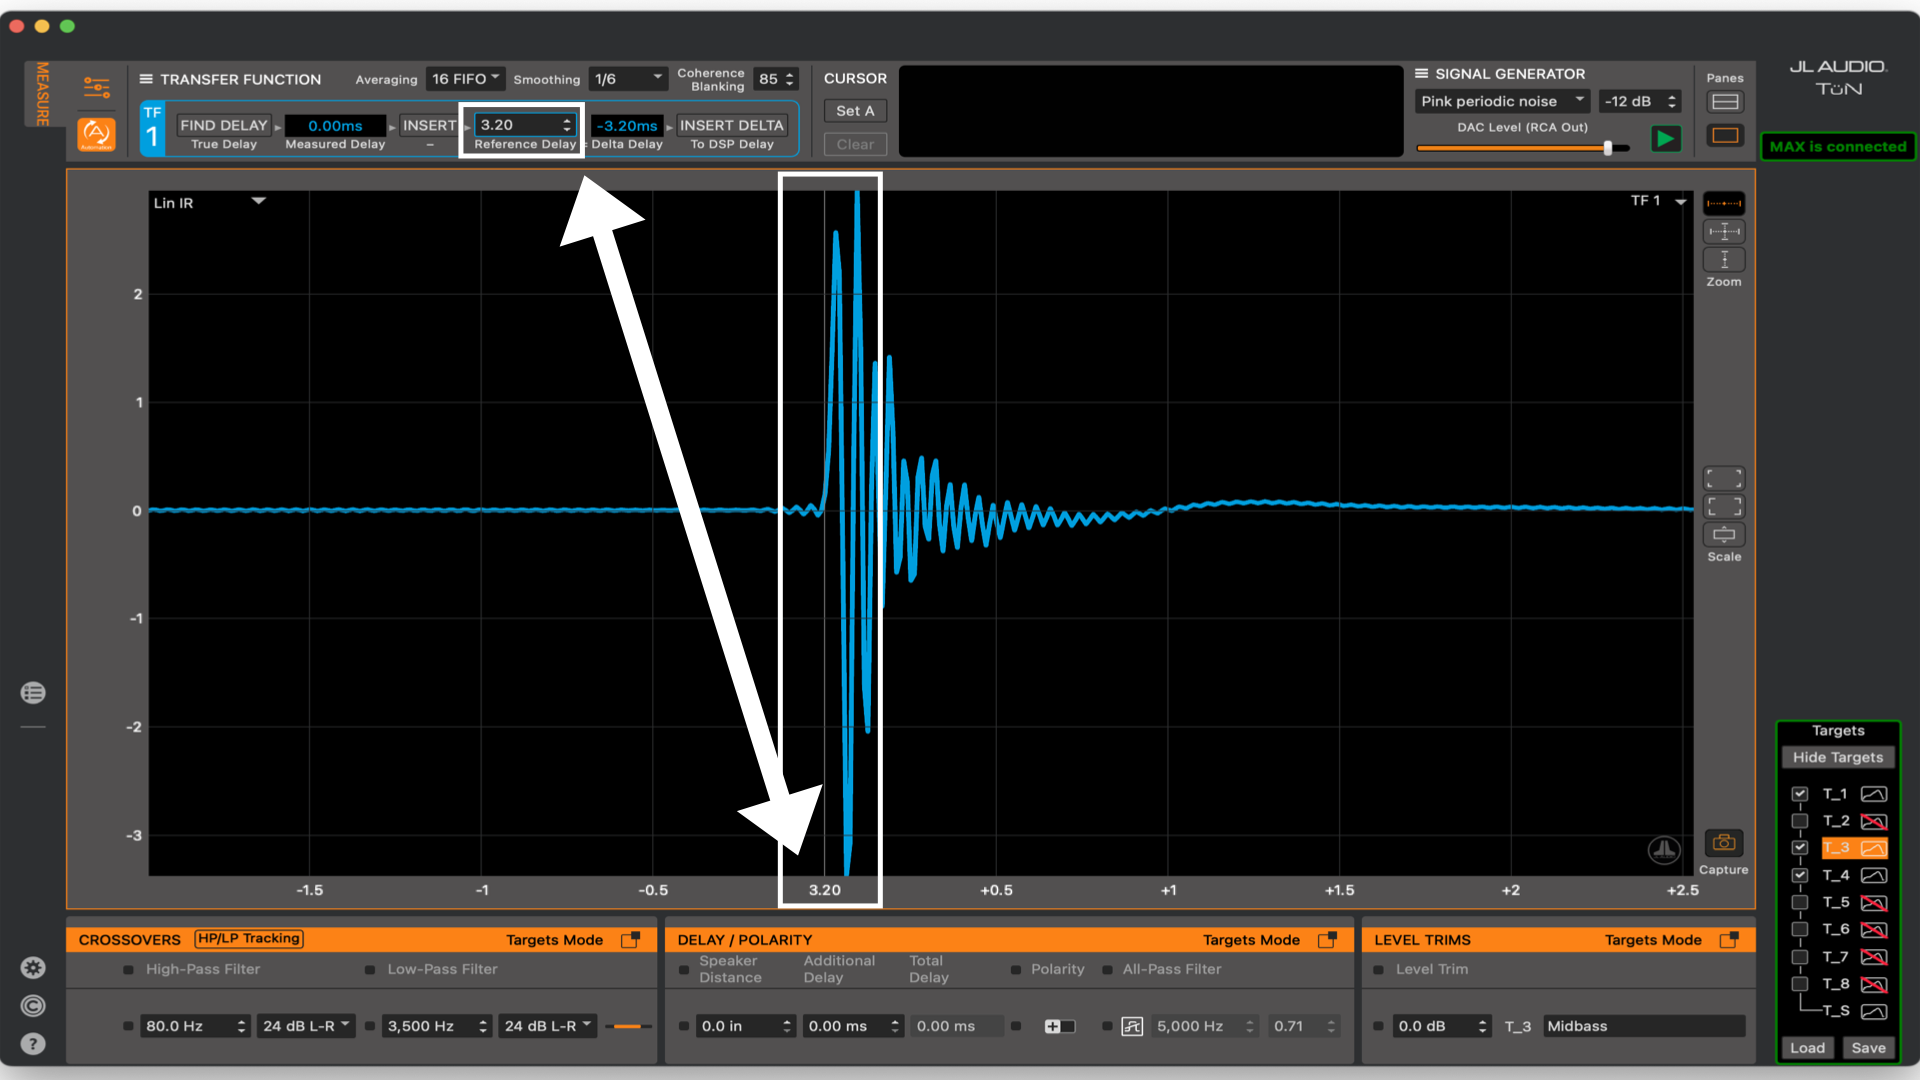
Image shows Impulse Response Measurement of the Front Left Channel set as the Reference Delay
Capture this measurement by clicking on the Capture button or press the space bar and name it appropriately. Next, switch the probes from the front left channel to the front right channel. The right channel will show up either to the left indicating an earlier arrival, to the right indicating a later arrival, or at the same time as the left channel. How much earlier or later will determine the delay on the right channel compared to the left.
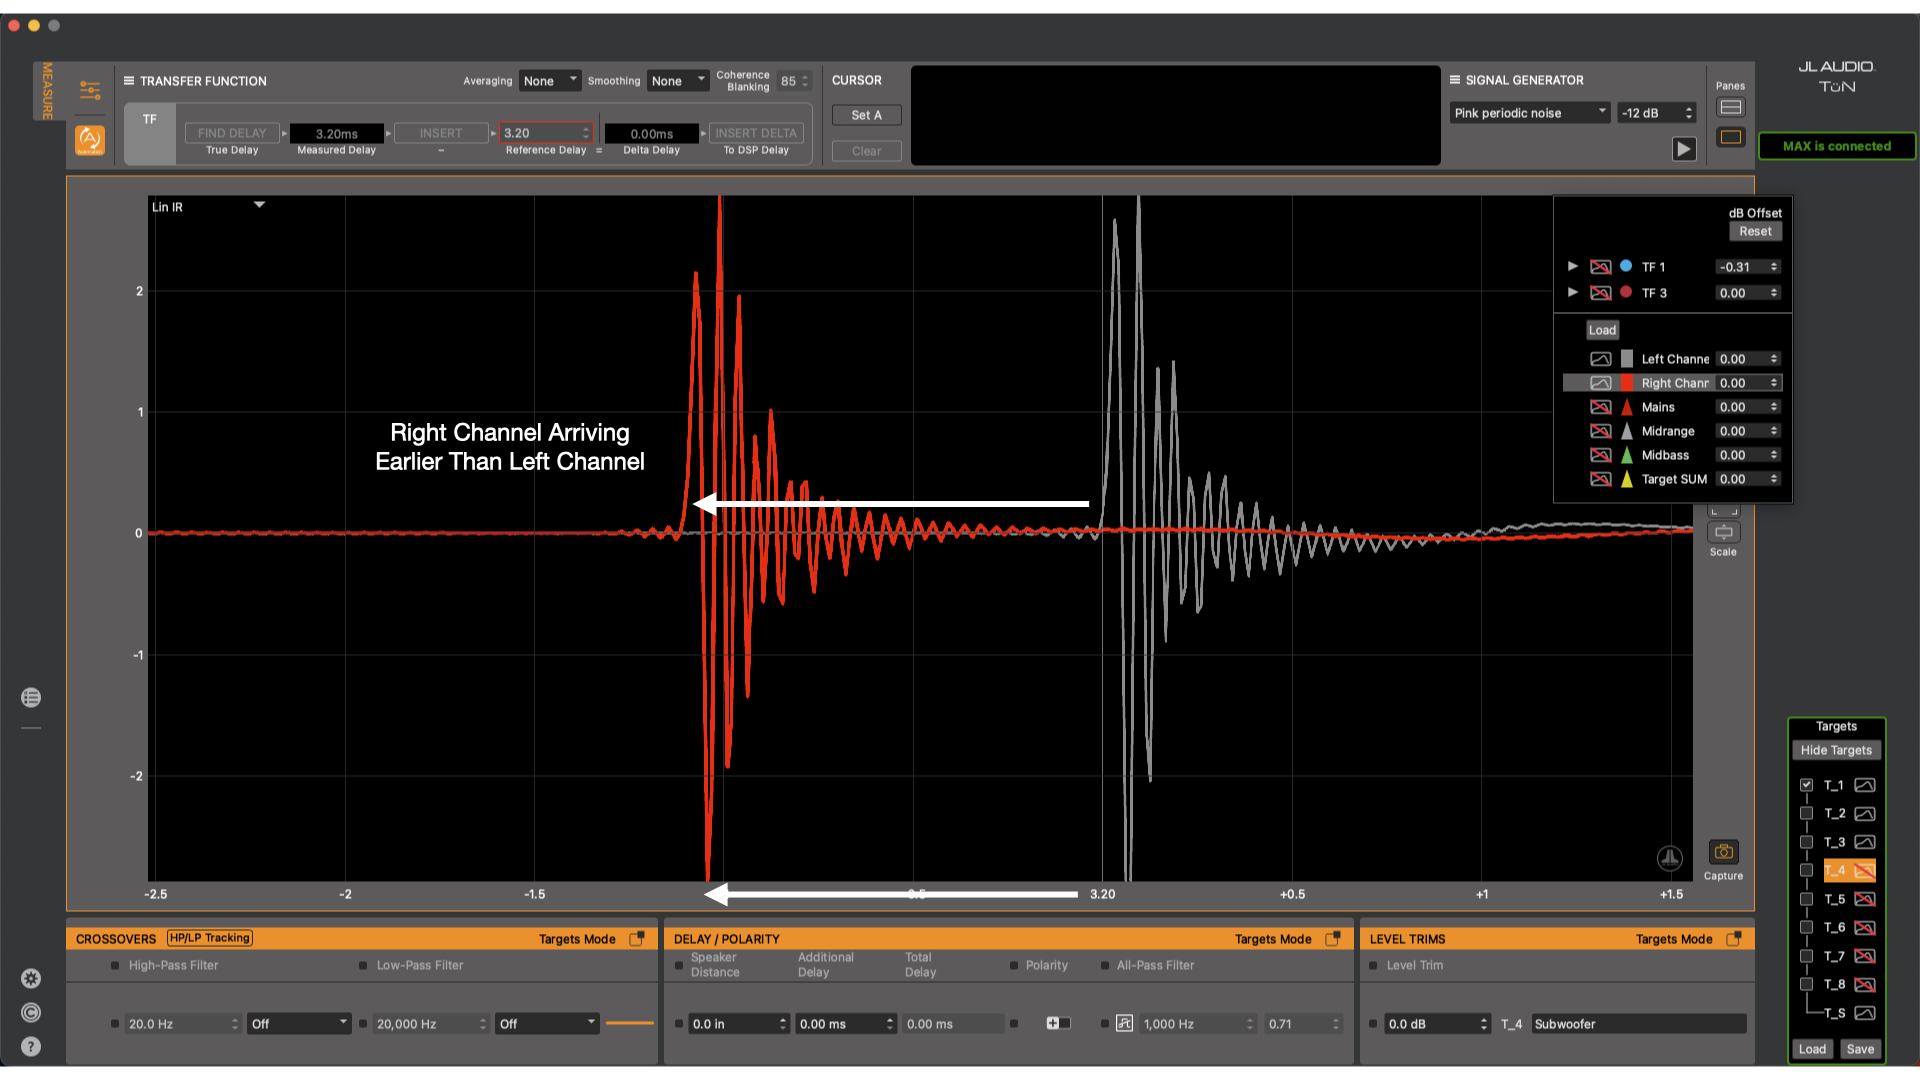
Image shows Front Right Channel arriving earlier than the Front Left Channel
To determine if there are any all-pass filters, simply switch the graph to phase and compare the two overlaid traces. The traces will already be visible because they were captured on the impulse response graph. To identify if there is an all-pass filter, look at each trace individually and look for any areas where the trace drops off of the bottom of the graph and wraps back to the top of the graph. This is what we call a phase wrap which is indicative of either a high-pass, low-pass or all-pass filter. If there is no frequency response roll off on the RTA but the phase wrap is present, then there is an all-pass filter. If there are no phase wraps and the trace never runs off the bottom or top of the graph then no all-pass filters are present.
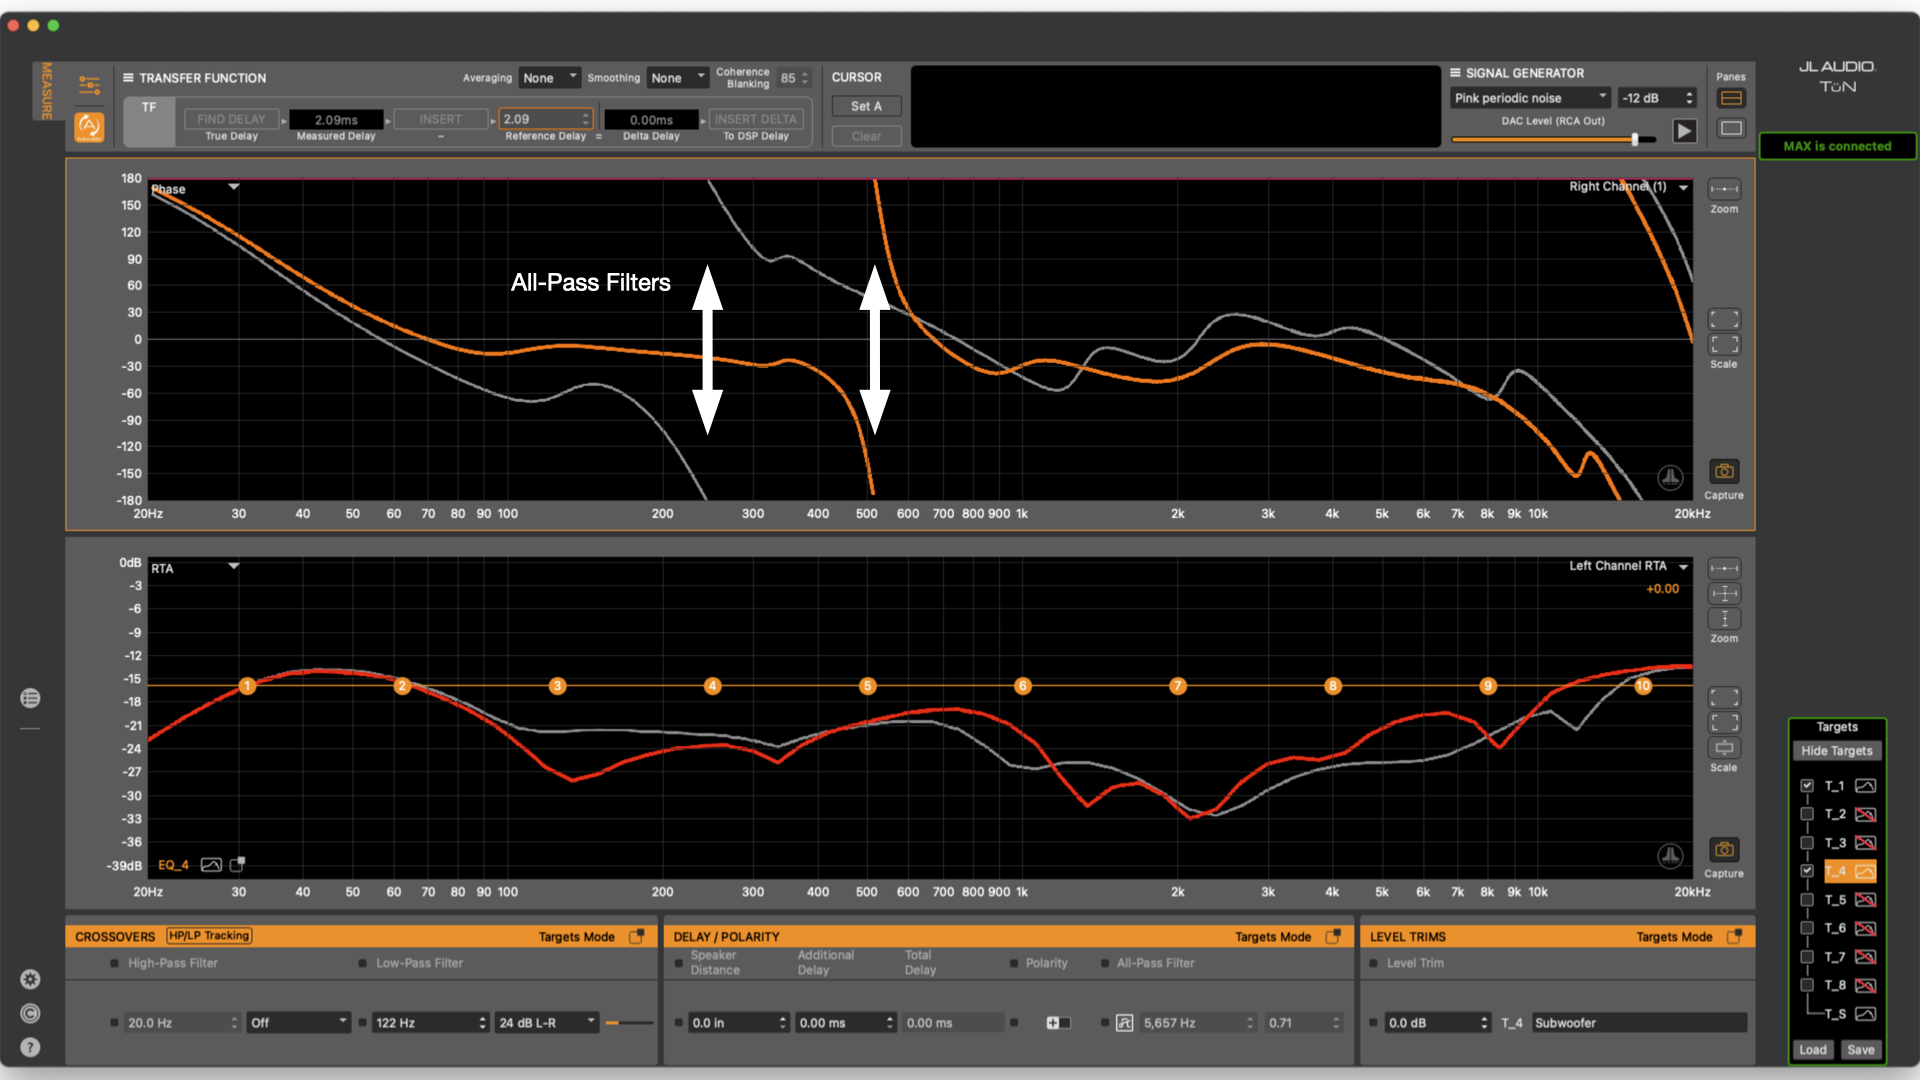
Image shows phase wraps indicating an all-pass filter on each channel
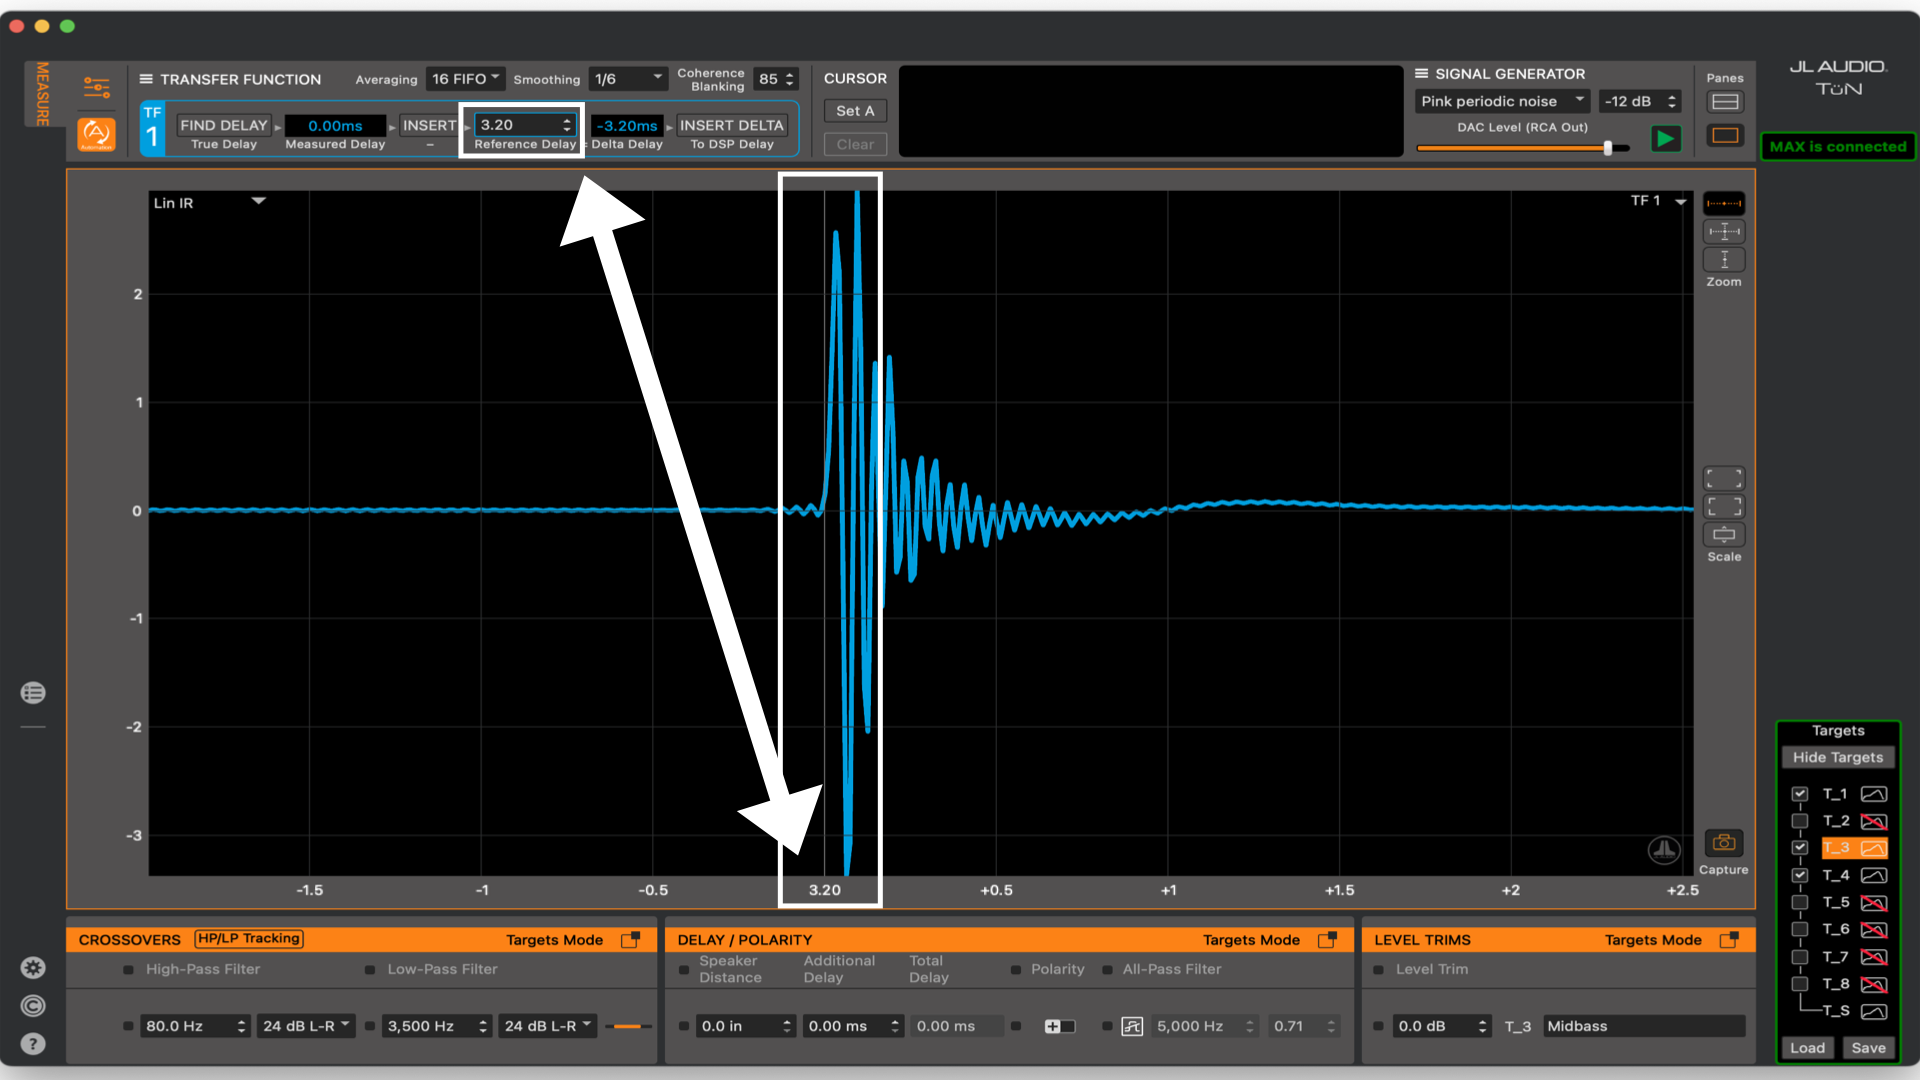
Image shows a green target matched to the electrical signal with no all-pass filter engaged
Another thing that should be measured with this connection is at what volume the source unit begins clipping. Switch to the Scope graph and select Hi-Lev 1. Switch the signal generator to a sine wave at a desired frequency. Zoom into the data until it is visible, then turn the source unit volume up until the sine wave begins to “square off”. Clipping the output occurs when the radio or amplifier it exceeds its maximum output capabilities.
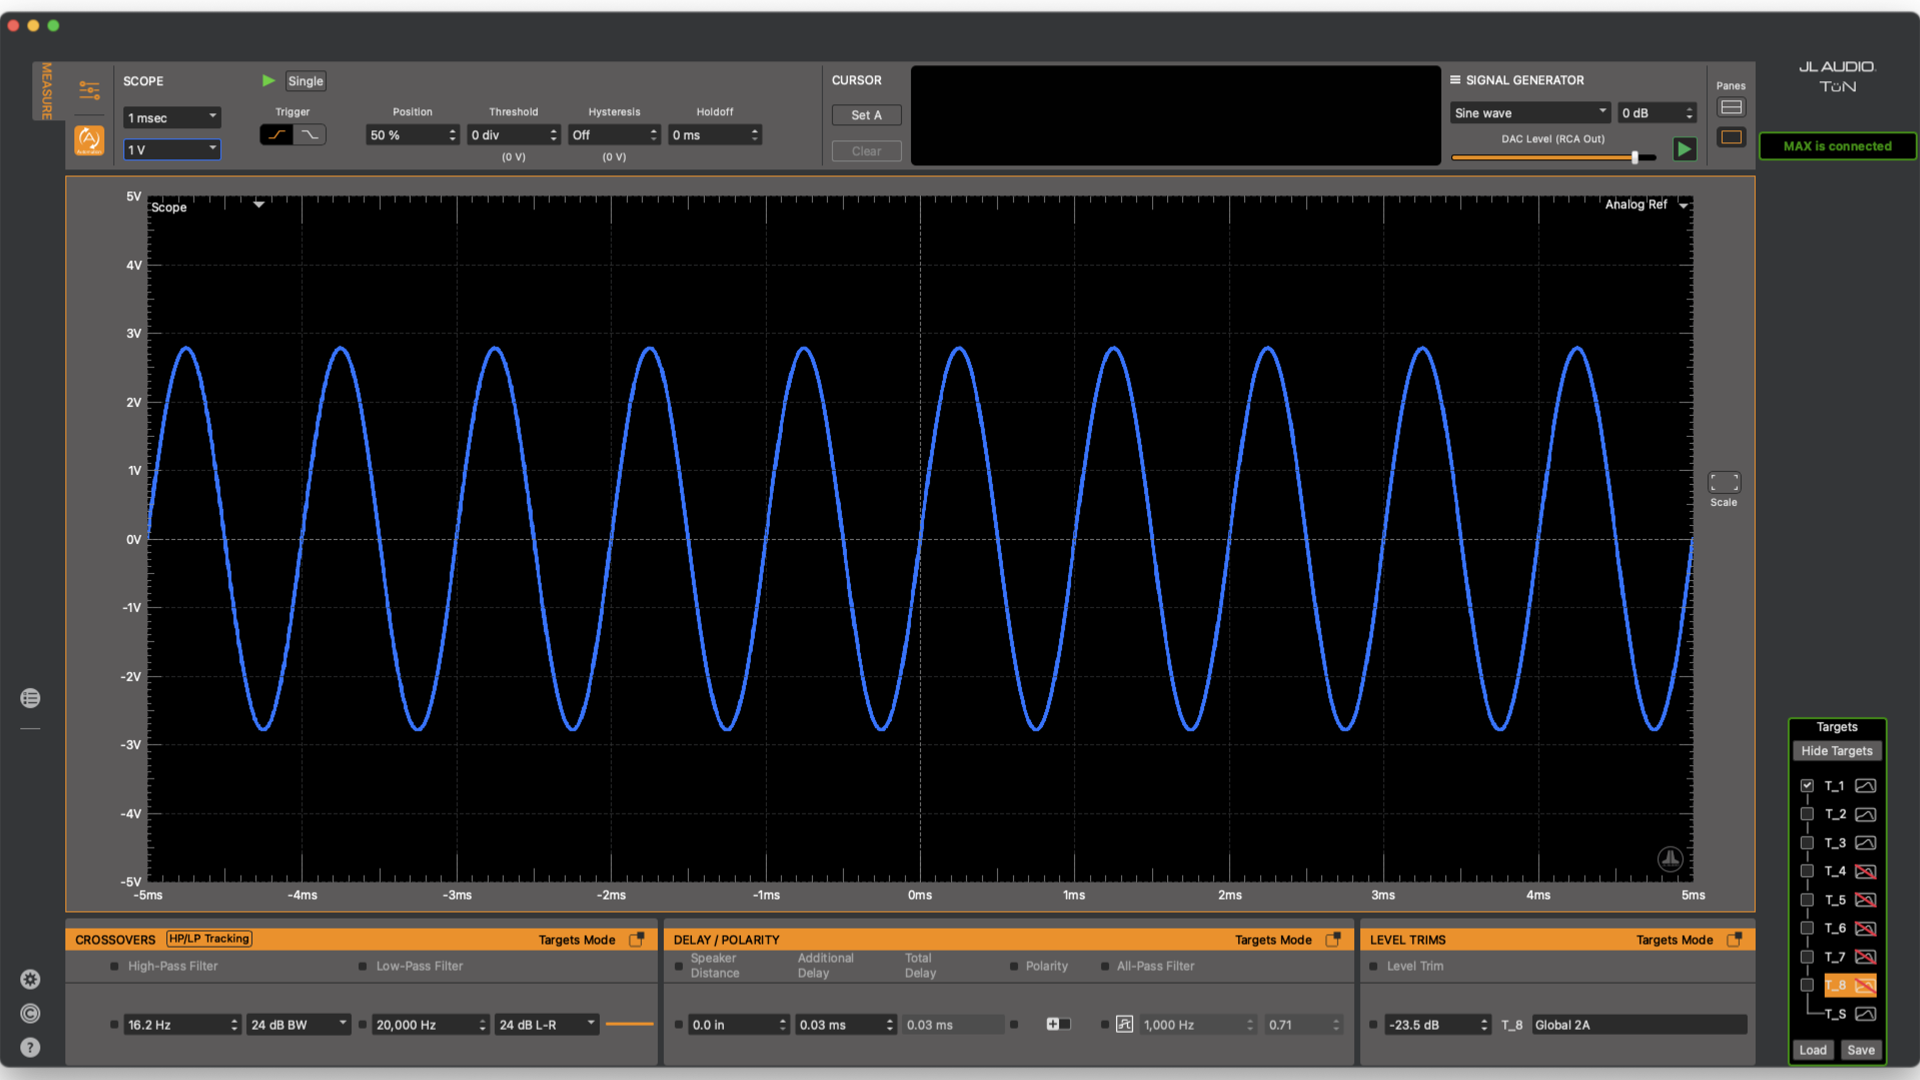
Image shows signal a clean sine wave signal on the Scope
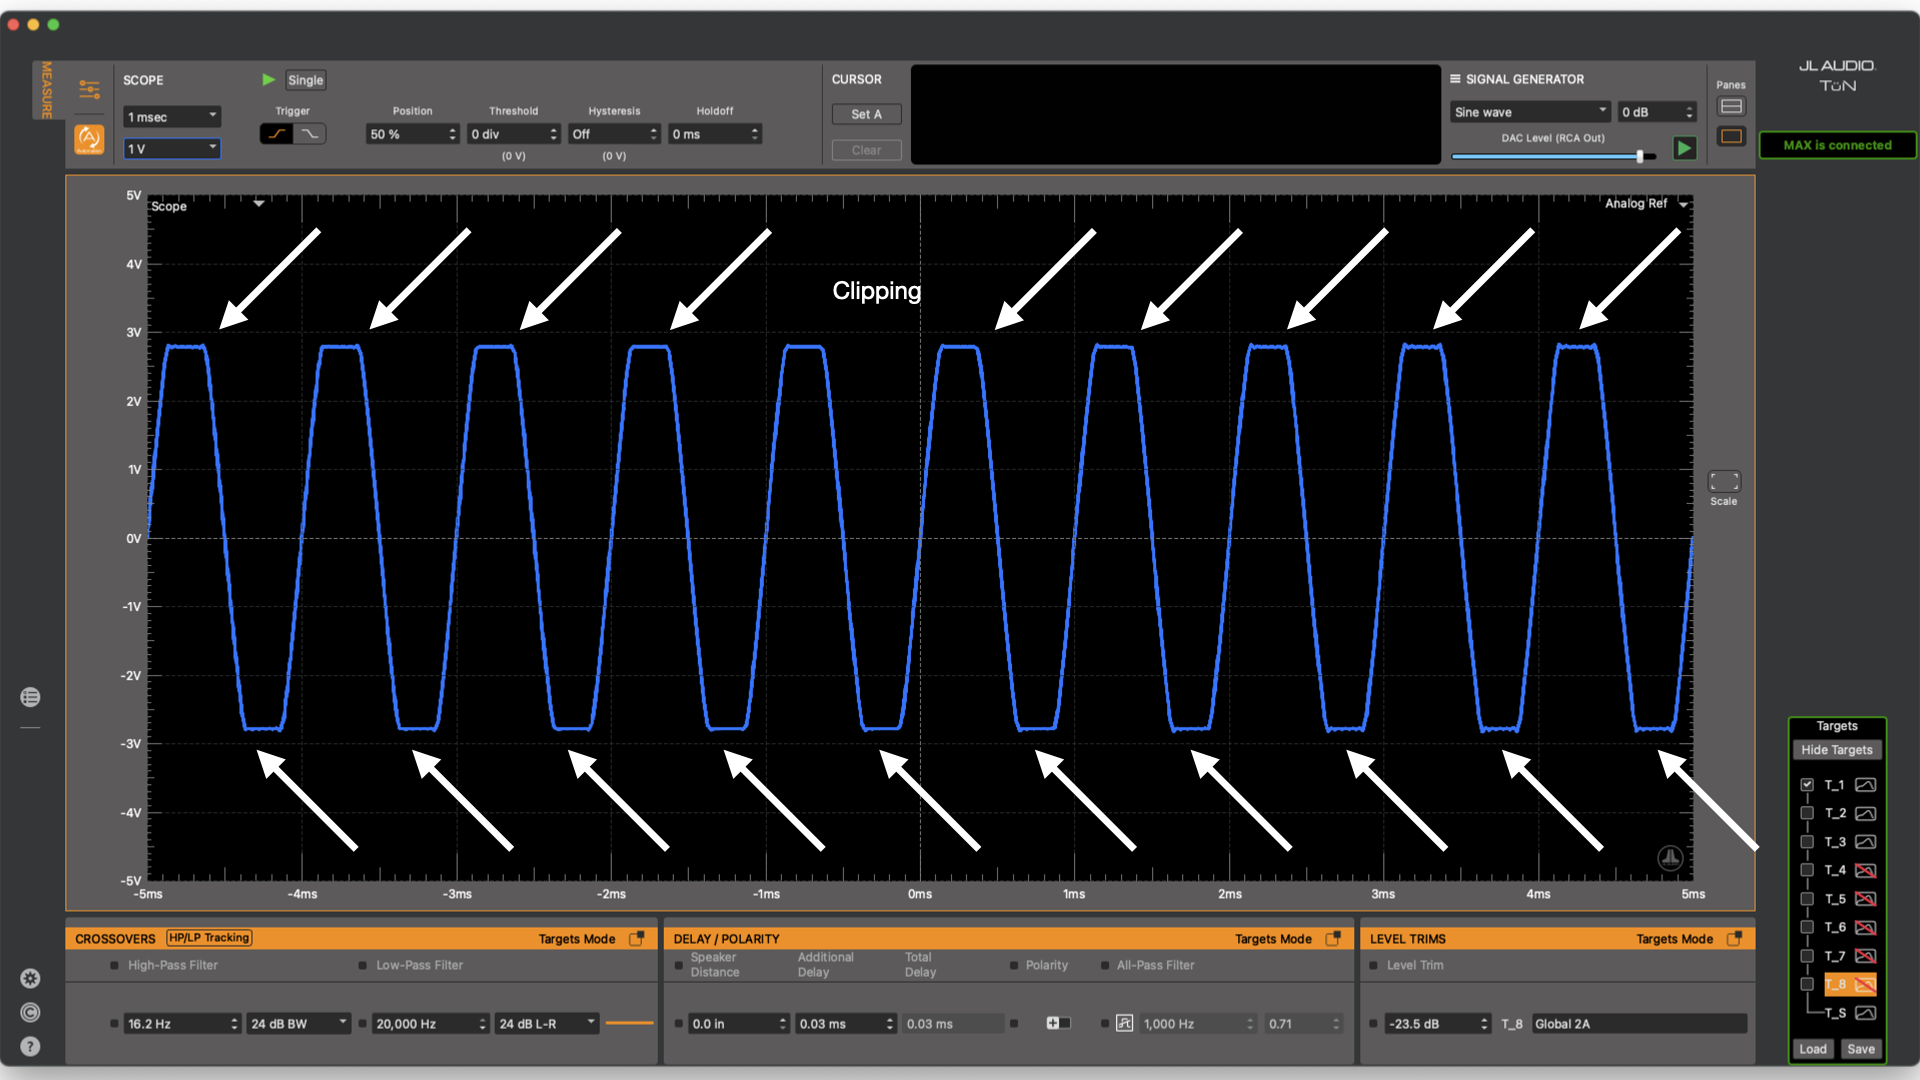
Image shows a clipped sine wave on the Scope
It is also possible to look at the distortion that occurs when overdriving the source unit. Have two graphs visible and choose the RTA on the other graph. Turn off banding and averaging. Select Hi-Lev 1 and repeat the clipping test. There will be noise that will begin to appear out of the noise floor when close to the clipping point and it will continue getting worse as level increases.
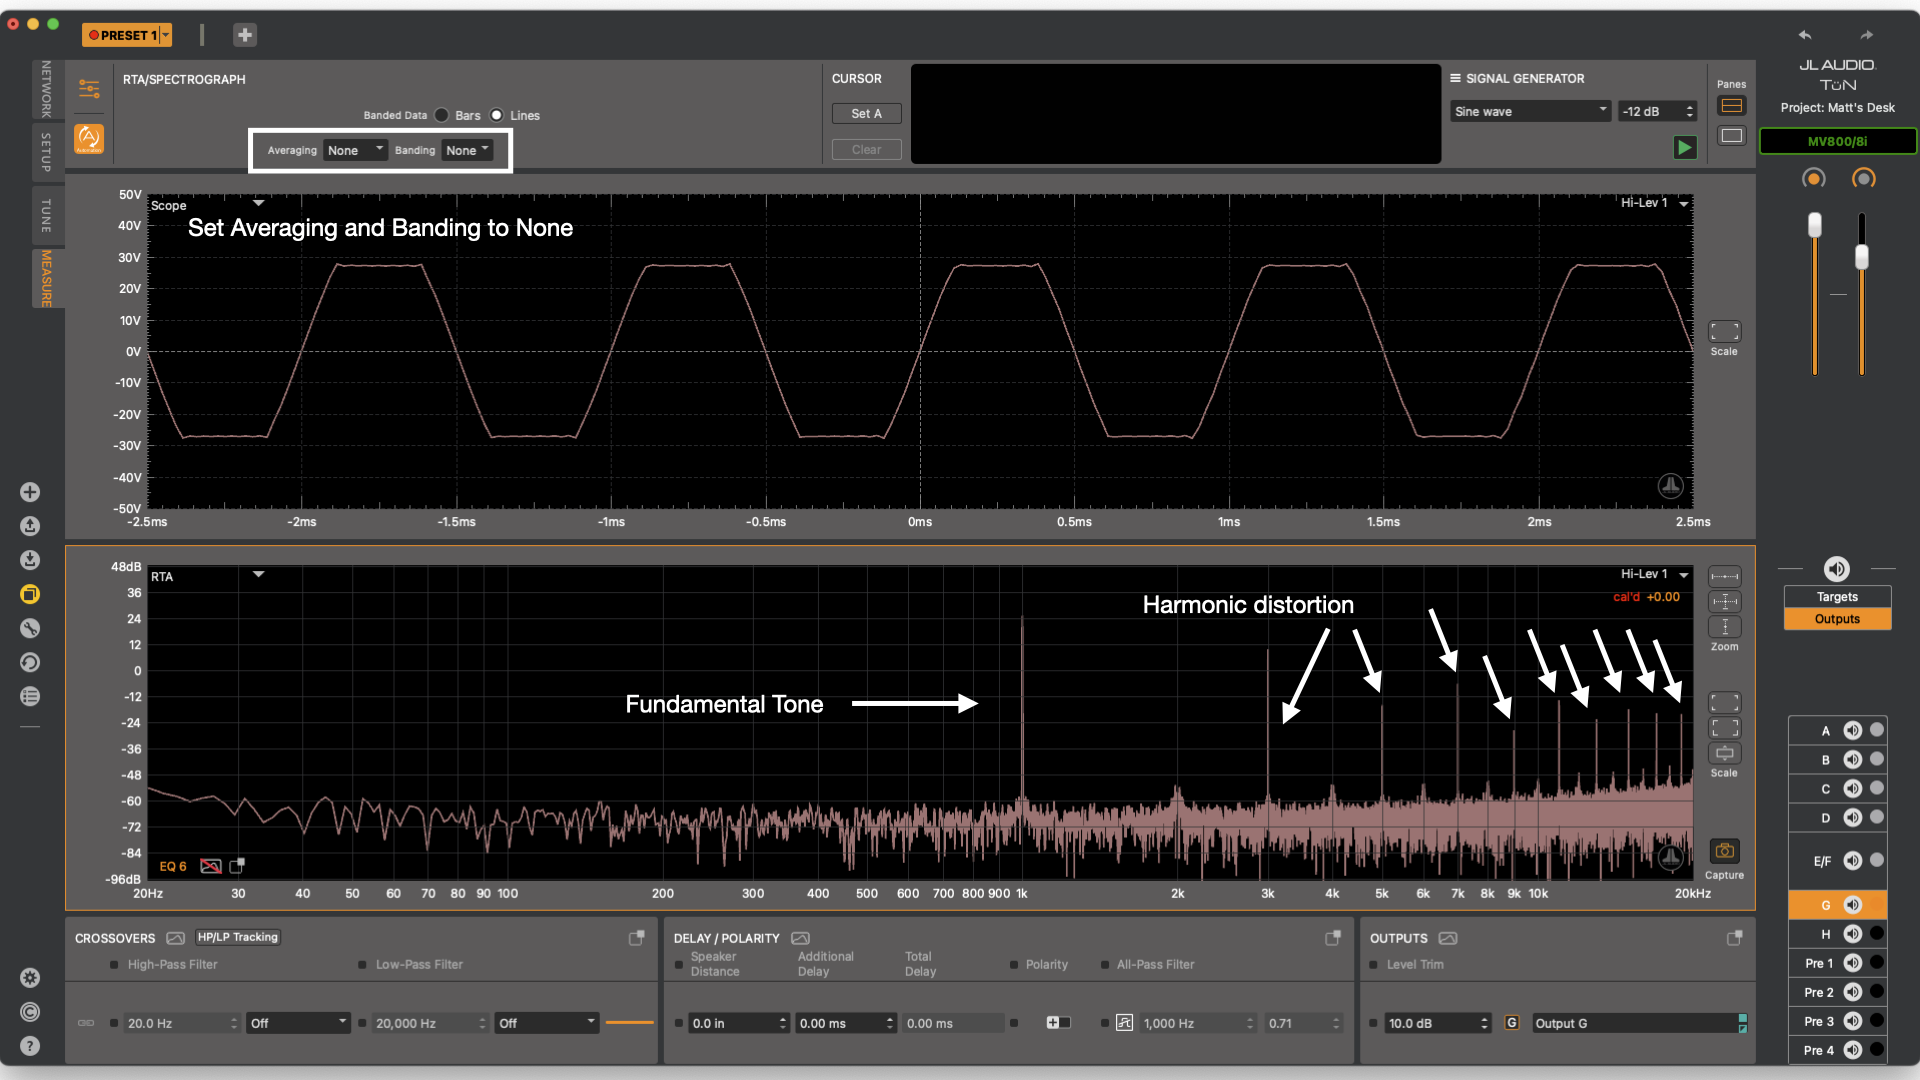
Image shows signal clipping on the scope and harmonic distortion on the RTA
These test methods make it much easier to understand what kind of processing is being applied in the source unit/amplifier. If there are any delay differences between left and right, a JL Audio FiX™ OEM Integration Processor may be a great option as it will attempt to correct any delay between channels and flatten the frequency response. If using a JL Audio LoC-22 or source unit outputs directly into the DSP, it may create more work later as well as use up some of the equalizer bands that may be needed for ‘curve shaping’ (Matching a speaker’s frequency response to a target).
Now, if a vehicle does not have an auxiliary input, there are other ways to take these measurements but that will be the subject of a different article. (Connecting MAX™ to Your Audio System) With the data measured from the system, it will be easy to make smart decisions on how to proceed with the system design and installation.
Moving on to measuring impedance. There are many reasons to measure a speaker’s impedance. One reason might be to check it its broken. This will not 100% determine if a speaker is broken, but if there is a large failure or if something is making contact with the moving parts of the speaker, this can help to visualize issues. Simply connect the impedance probe to MAX™, and the alligator clips to the speaker. Boundaries around the speaker at the time of measurement will influence it, so make sure that the speaker is set in a stable place and undisturbed for the test. Also, make sure that there is not a lot of noise pollution as it may physically move the speaker cone which could alter the measurement. Open the Measure Settings, then the Measurement Setup Tab. Turn on TF1 Impedance Mode. Close this window then press Play on the Signal Generator Panel and the speaker will begin playing at a low level which is expected behavior. Select the Impedance graph from the Graph Type Combo Box and then select the input labeled “Impedance”. If everything is set up correctly, data will show up on the graph. If it doesn’t, try clicking the ‘Revert to Default Setup’ button (in the Measure Settings - General tab) check your connections and the speaker and retry the previous steps. The photos shown here are a fully functional speaker.
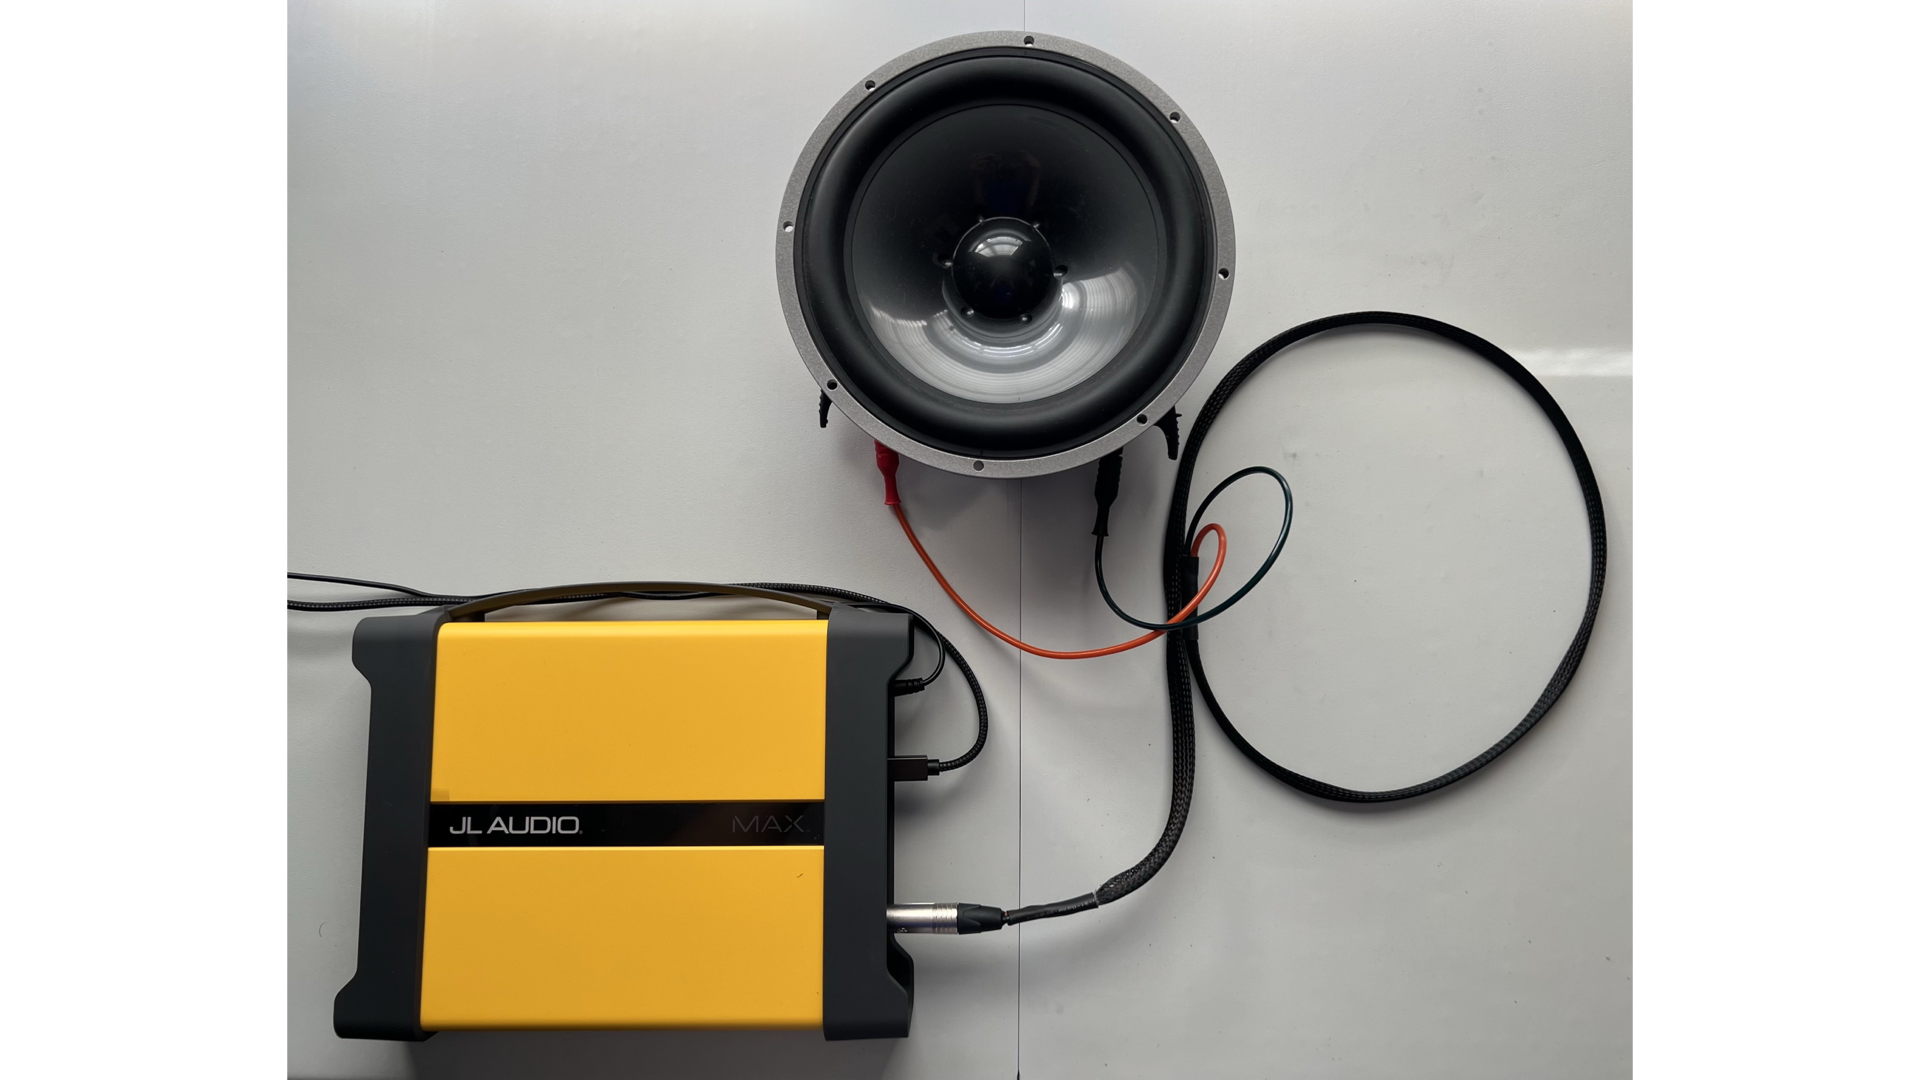
Image shows TRS probe connected to a speaker with alligator clips
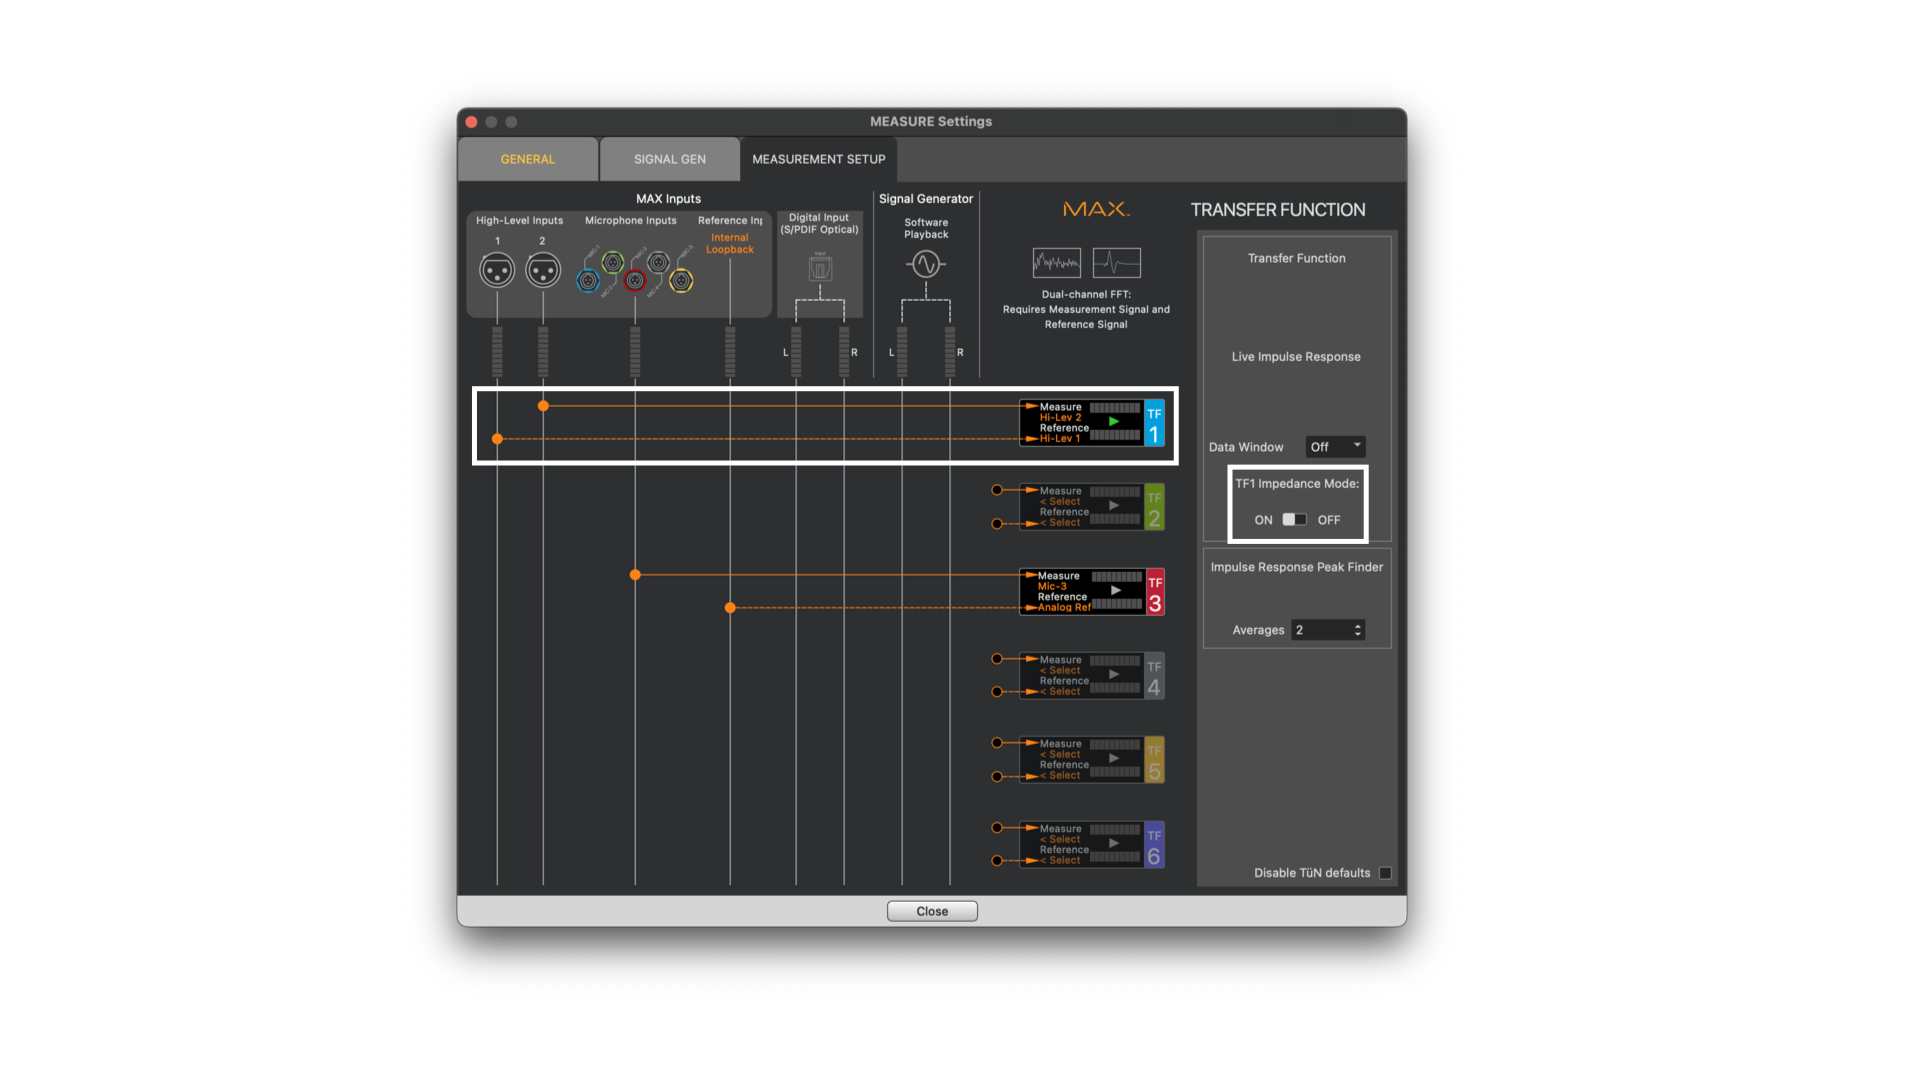
Image shows TF1 Impedance Mode engaged
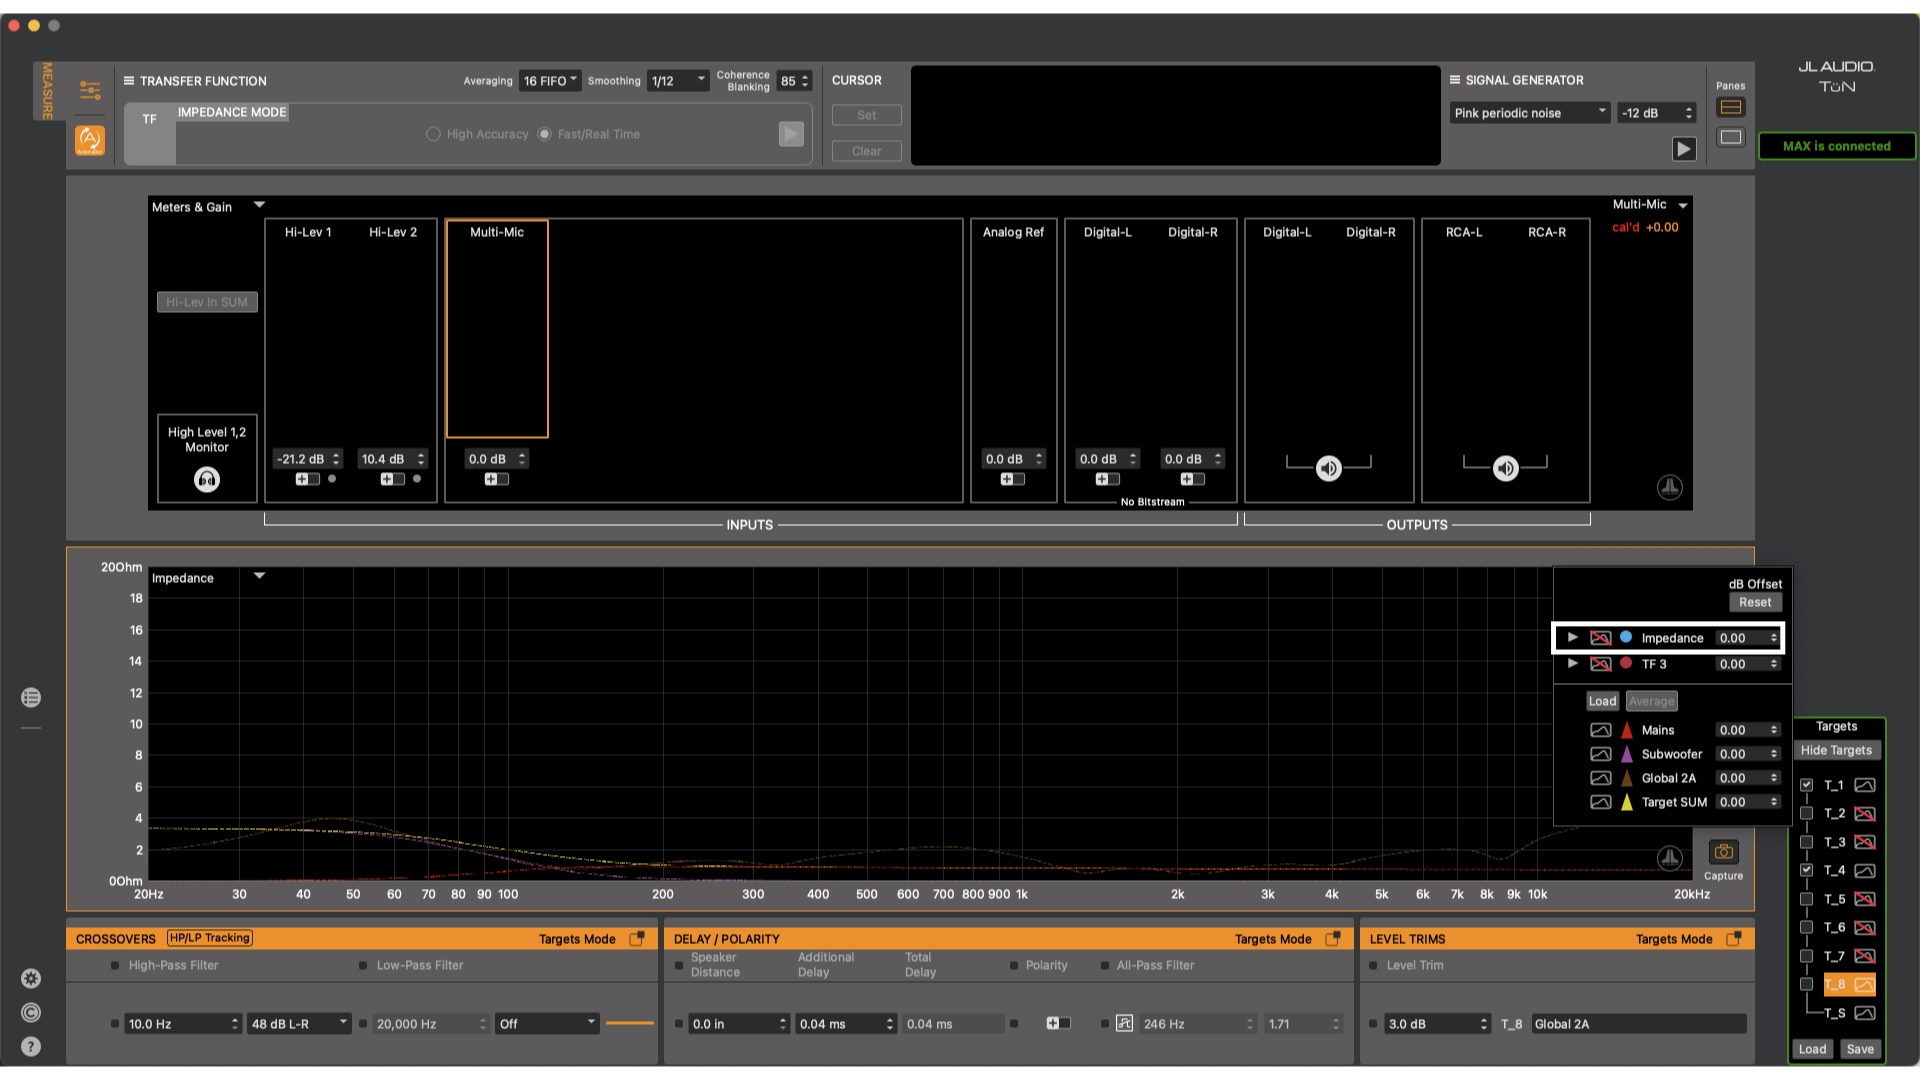
Image shows Impedance input on the Input Combo Box
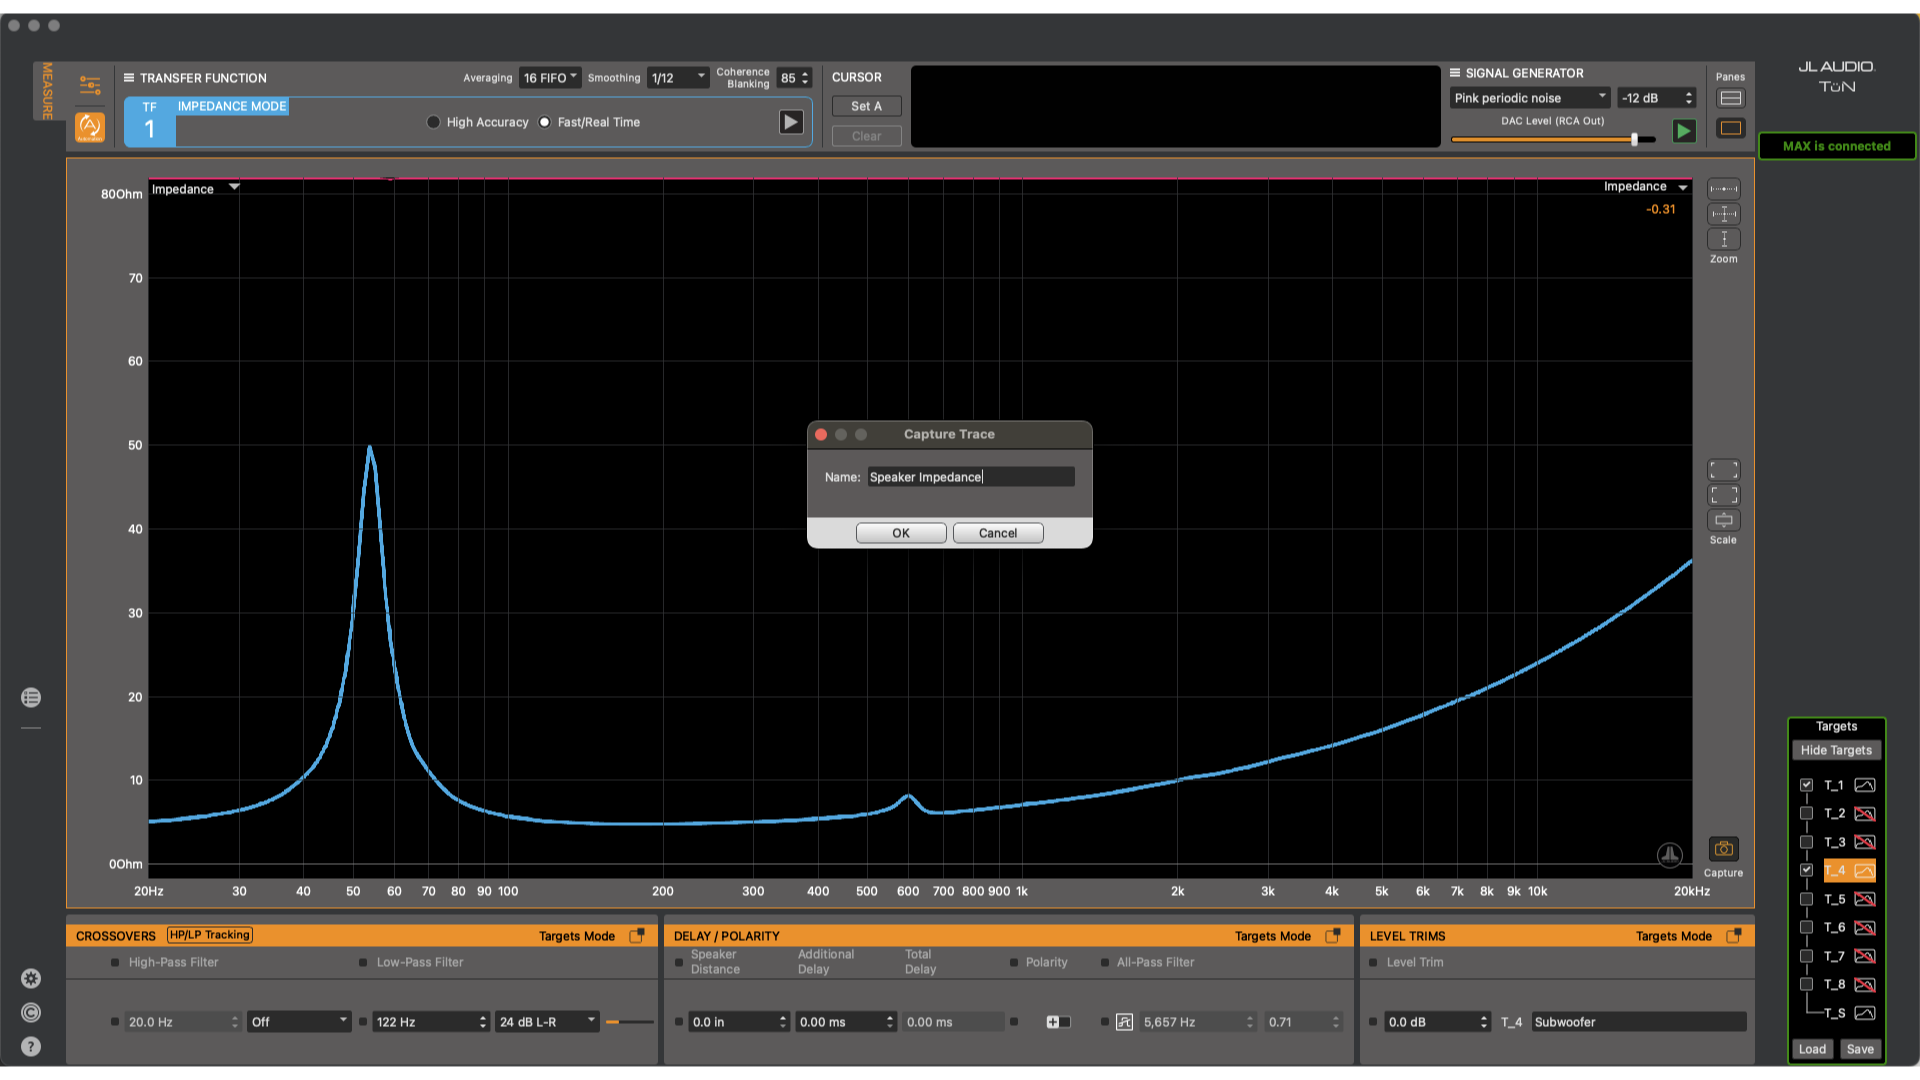
Image shows capturing an impedance measurement
It is possible to calibrate the Impedance measurement so that it is more accurate. Grab a multimeter and a 10 ohm or similar value resistor.Measure the resistor with the multimeter and note the value. Now, connect the alligator clips from the TRS probe to the resistor.
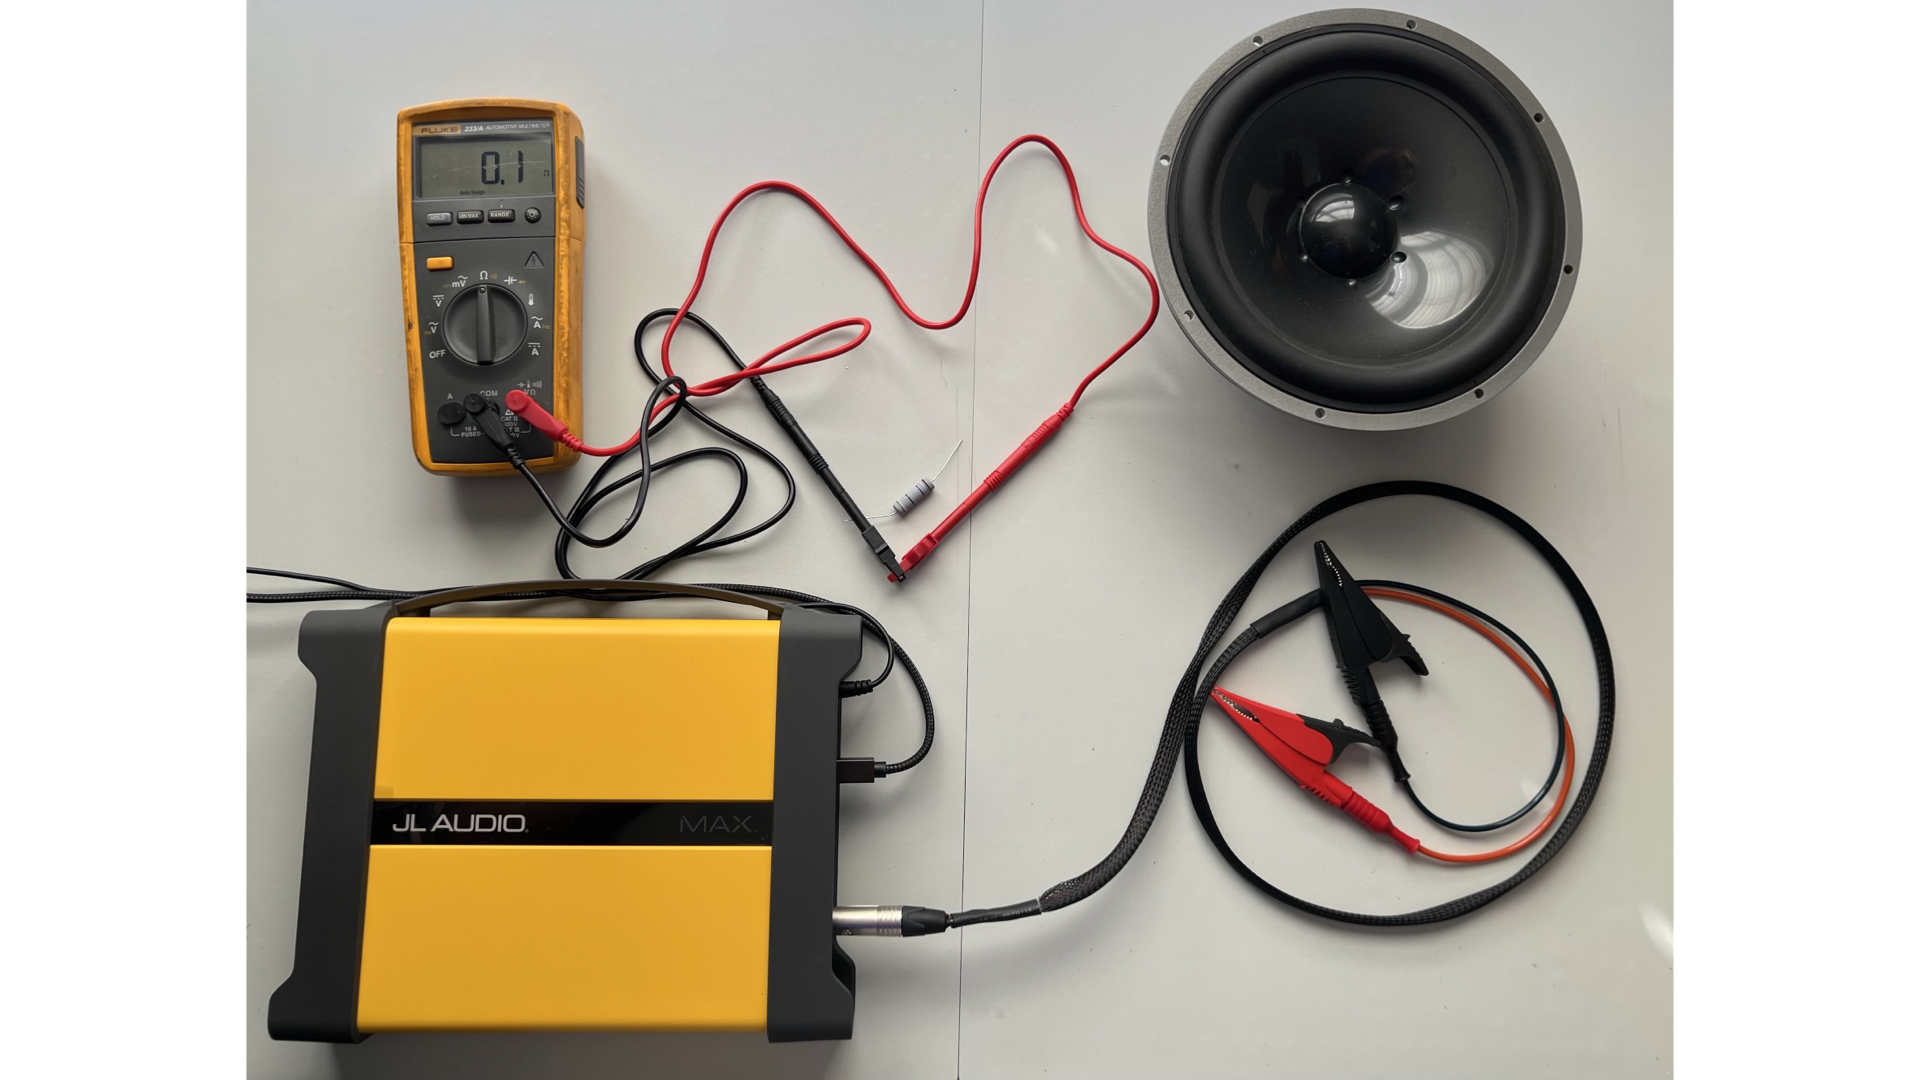
Image shows tools for taking impedance measurements with meter leads connected
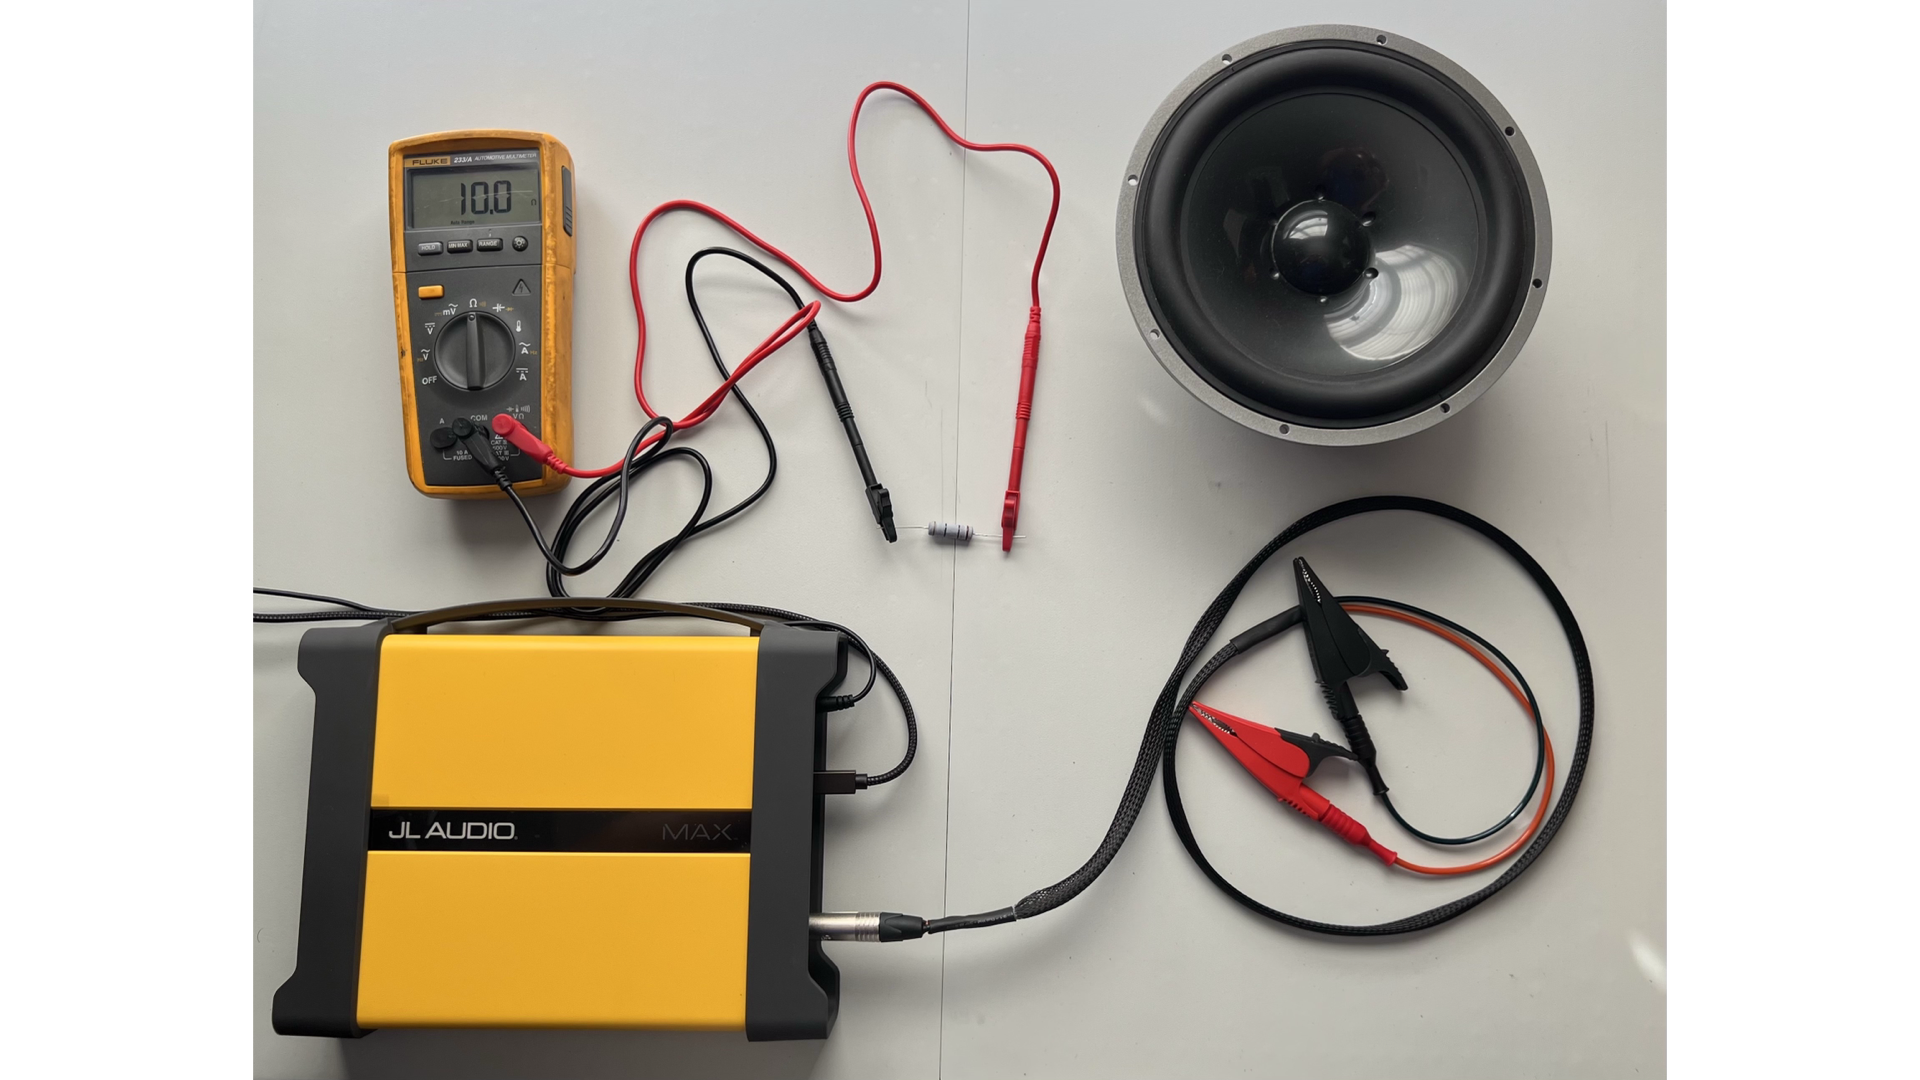
Image shows meter connected to 10 ohm resistor
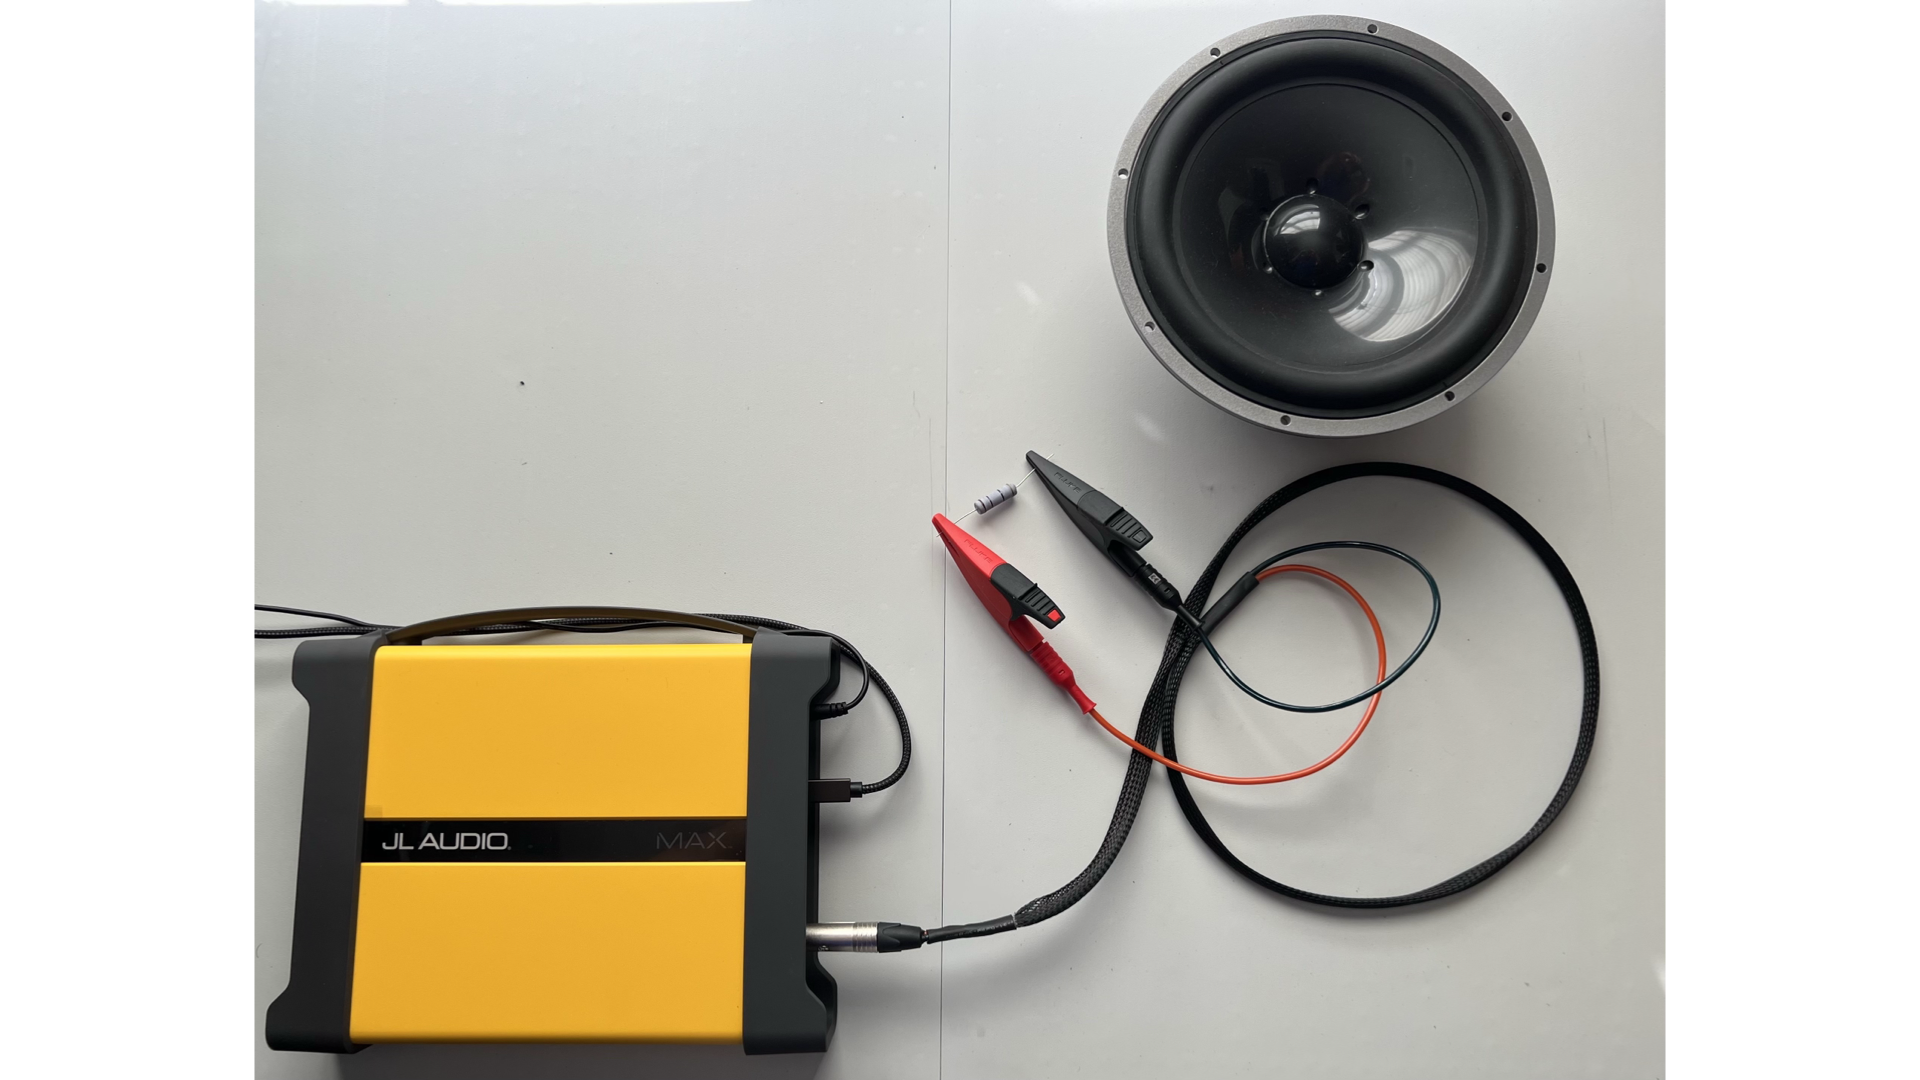
Image shows TRS probe alligator clips connected to 10 ohm resistor
While looking at the impedance graph, there will be a straight line across the graph and as the cursor moves across the data, the resistance and frequency will be displayed in the Information Display. The goal is to match the resistance to the value that was measured from the multimeter.
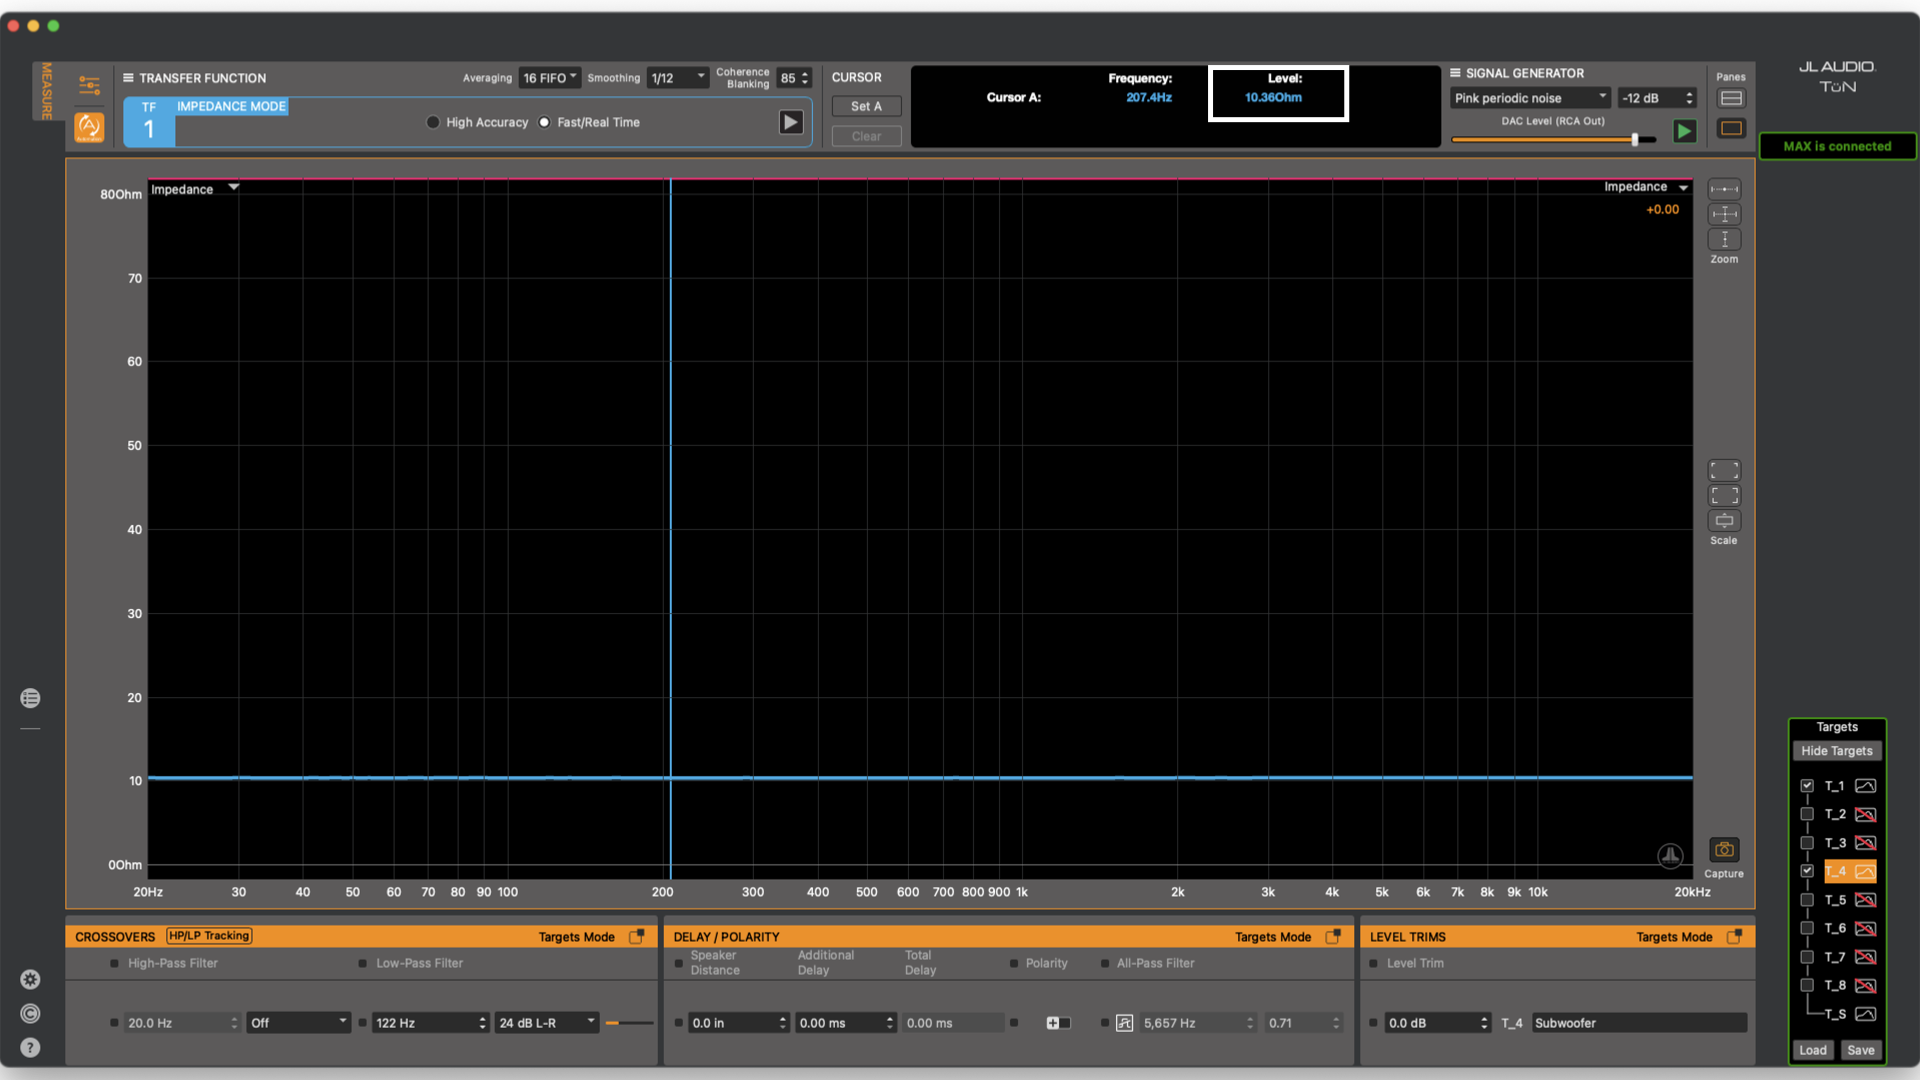
Image shows values for the cursor position in the information display
First, open the Meters & Gains panel in a second graph. Using the gain value under TF1, adjust it until the measured value is displayed correctly or very close. If minor adjustments need to be made, this can be done in the Input Combo Box. There will be a number field next to the input labeled “Impedance” that can be used to fine tune the value. The value can either be calculated manually and entered or use the hotkeys to move the trace up and down. (PC – Control + arrow up or down) (MAC – Command + arrow up or down).
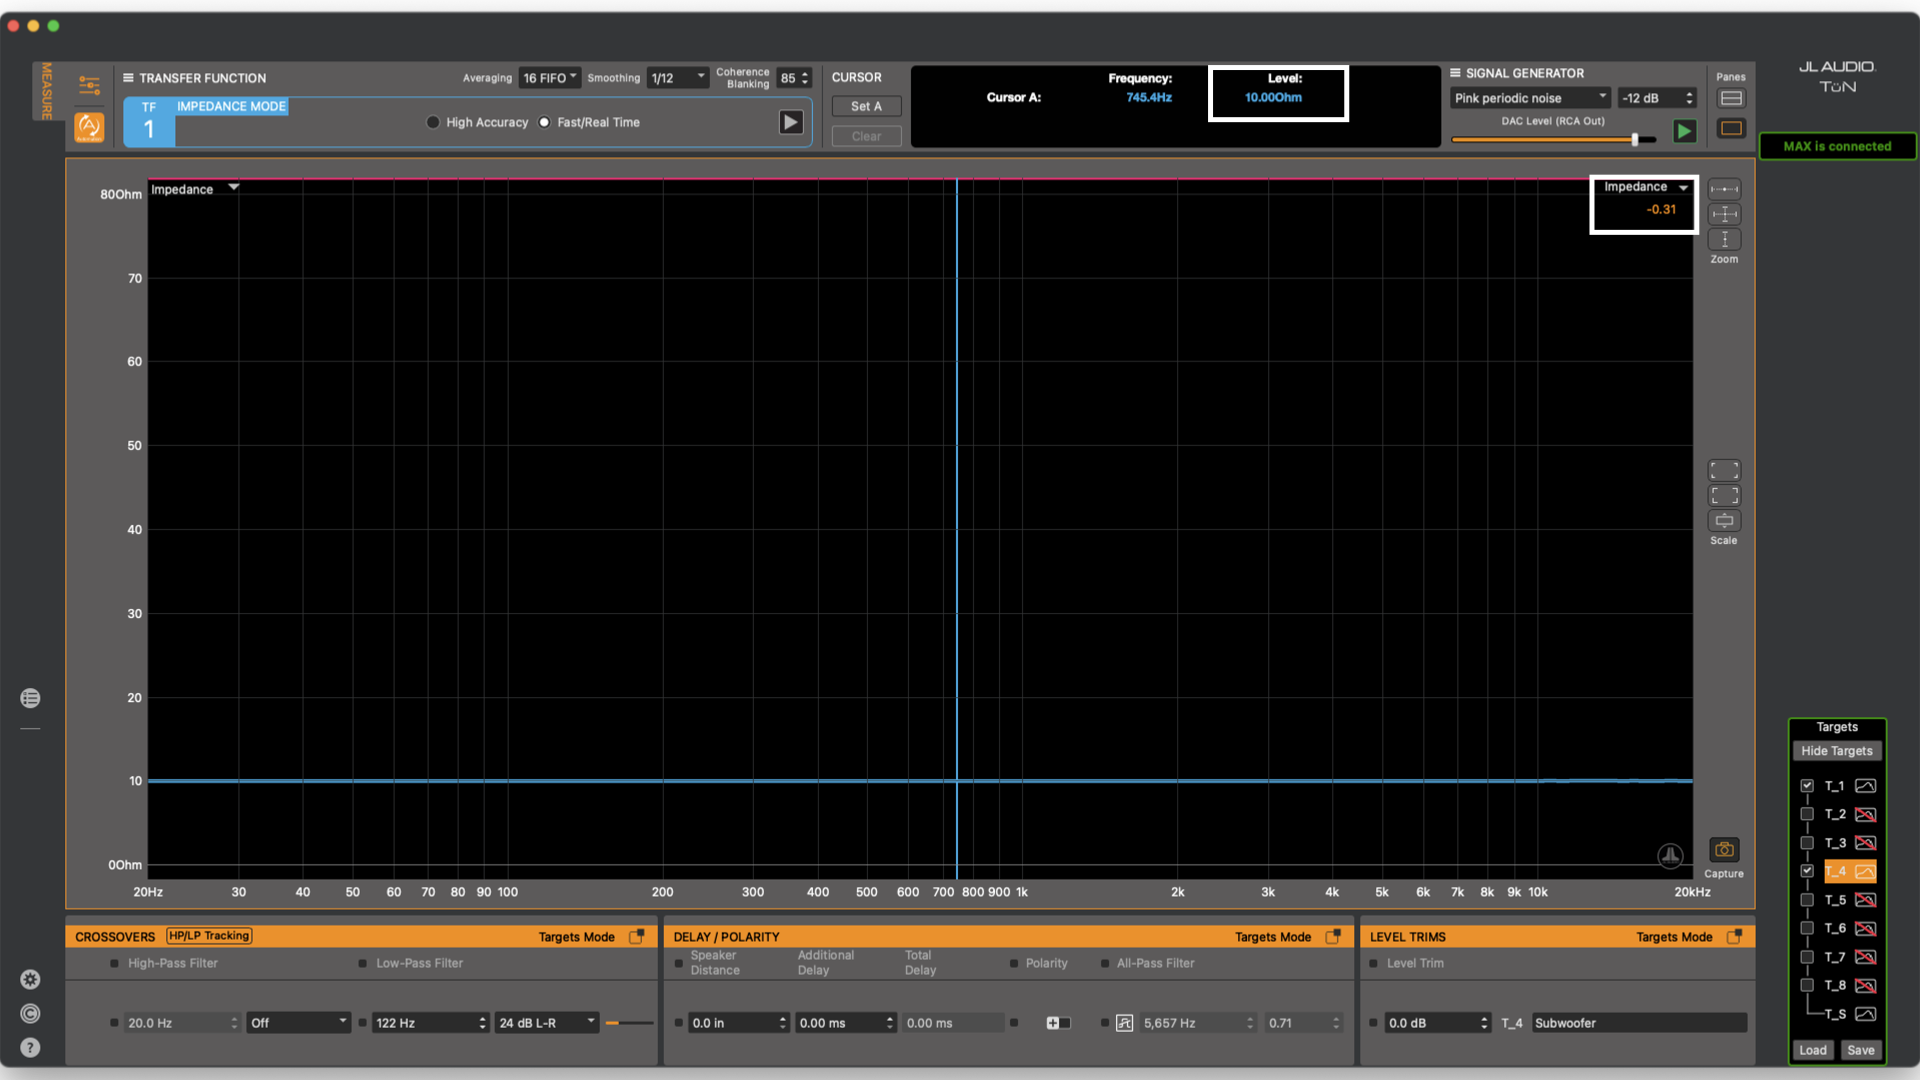
Image shows offset applied to trace with cursor position value in information display
This method of impedance testing is considered a 2-wire impedance measurement. There are also several 4-wire methods. When using a 2-wire impedance method, the quality of the TRS connector contacts and how well it is seated in the port can have a pretty significant impact on the data. Using a 4-wire impedance method usually removes the possibility of this issue. This is done by measuring the voltage externally. This is usually referred to as an ‘External Voltage Sense’. A small test cable is required. It needs to have an RCA on one end and alligator clips on the other.
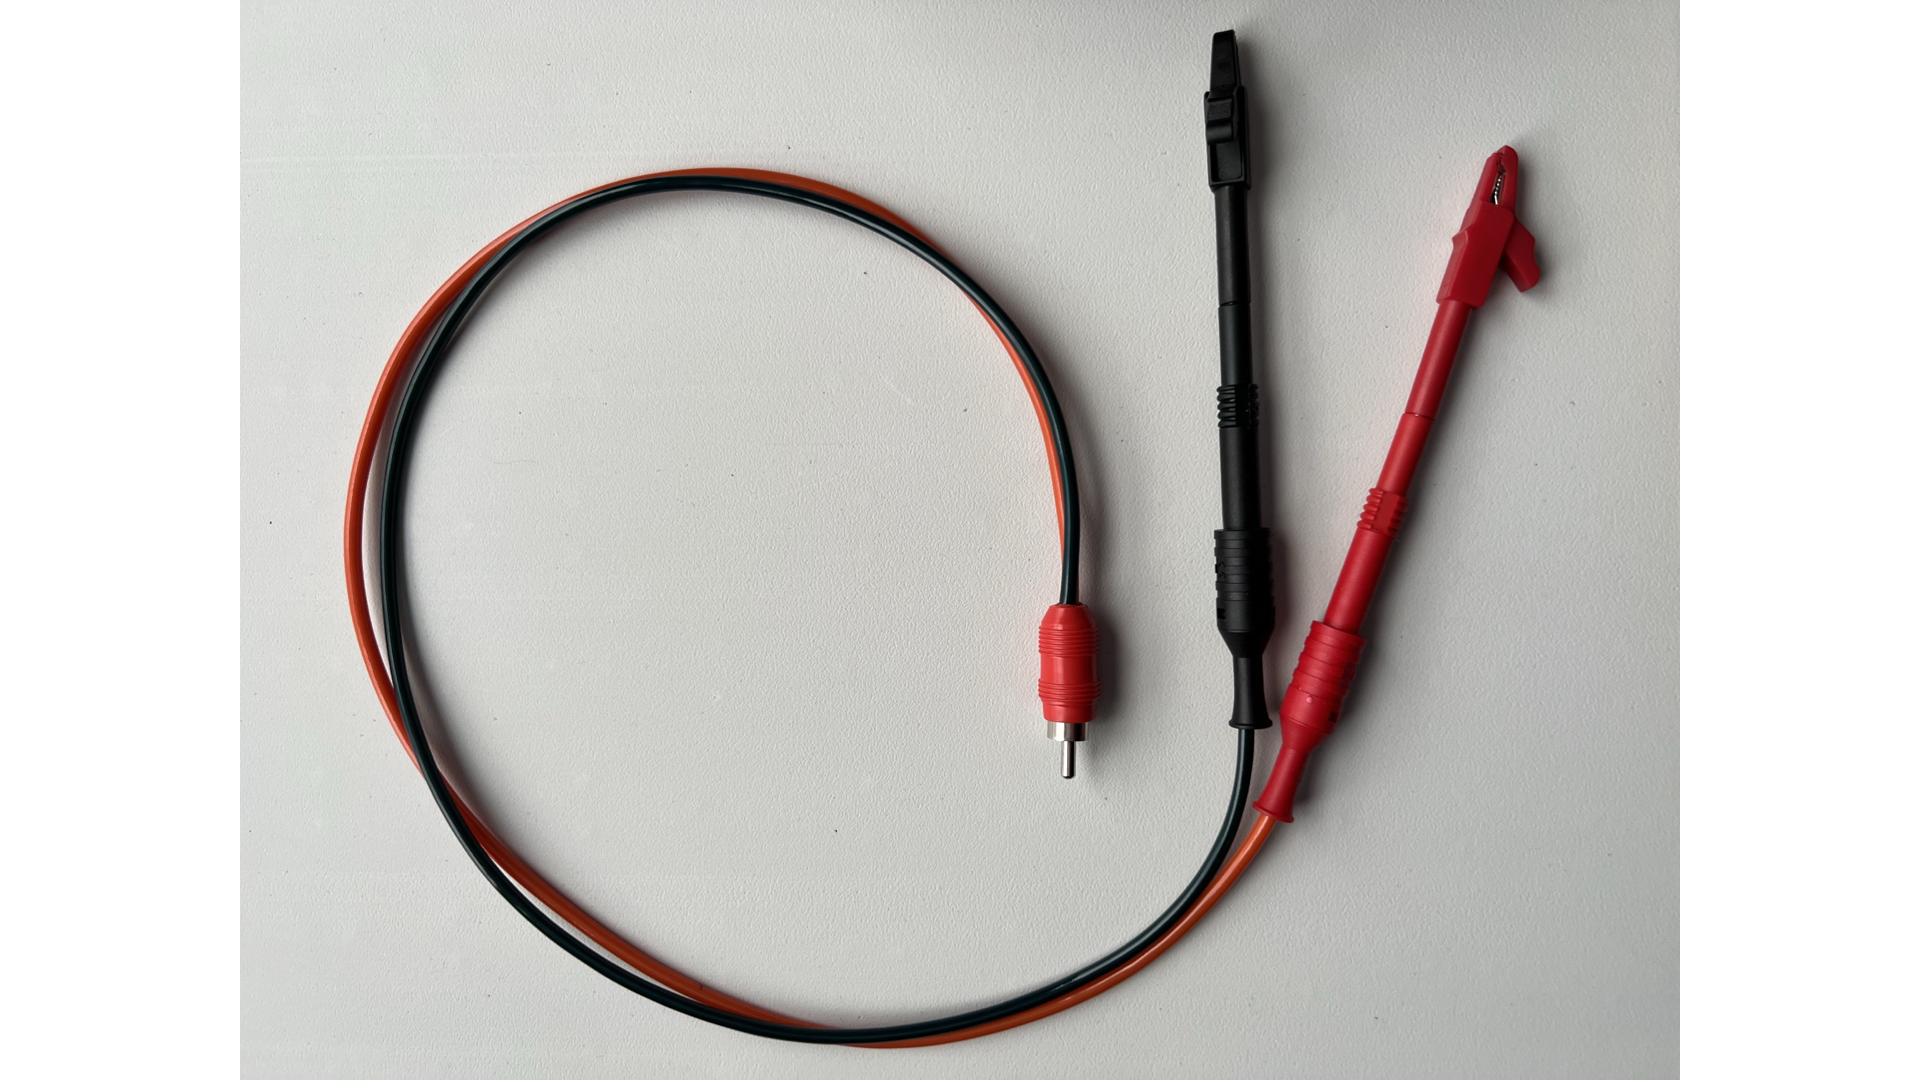
Image shows RCA to test lead cable
The new input should be calibrated to be accurate. Head over to the Measurement Setup tab to route a second TF Engine. Using an open TF engine, route the Measure signal to the Reference Input channel. Click on the Reference Input word to change the Reference Input
(currently Internal Loopback) to External Reference. Then, route the reference to High-Level 1.
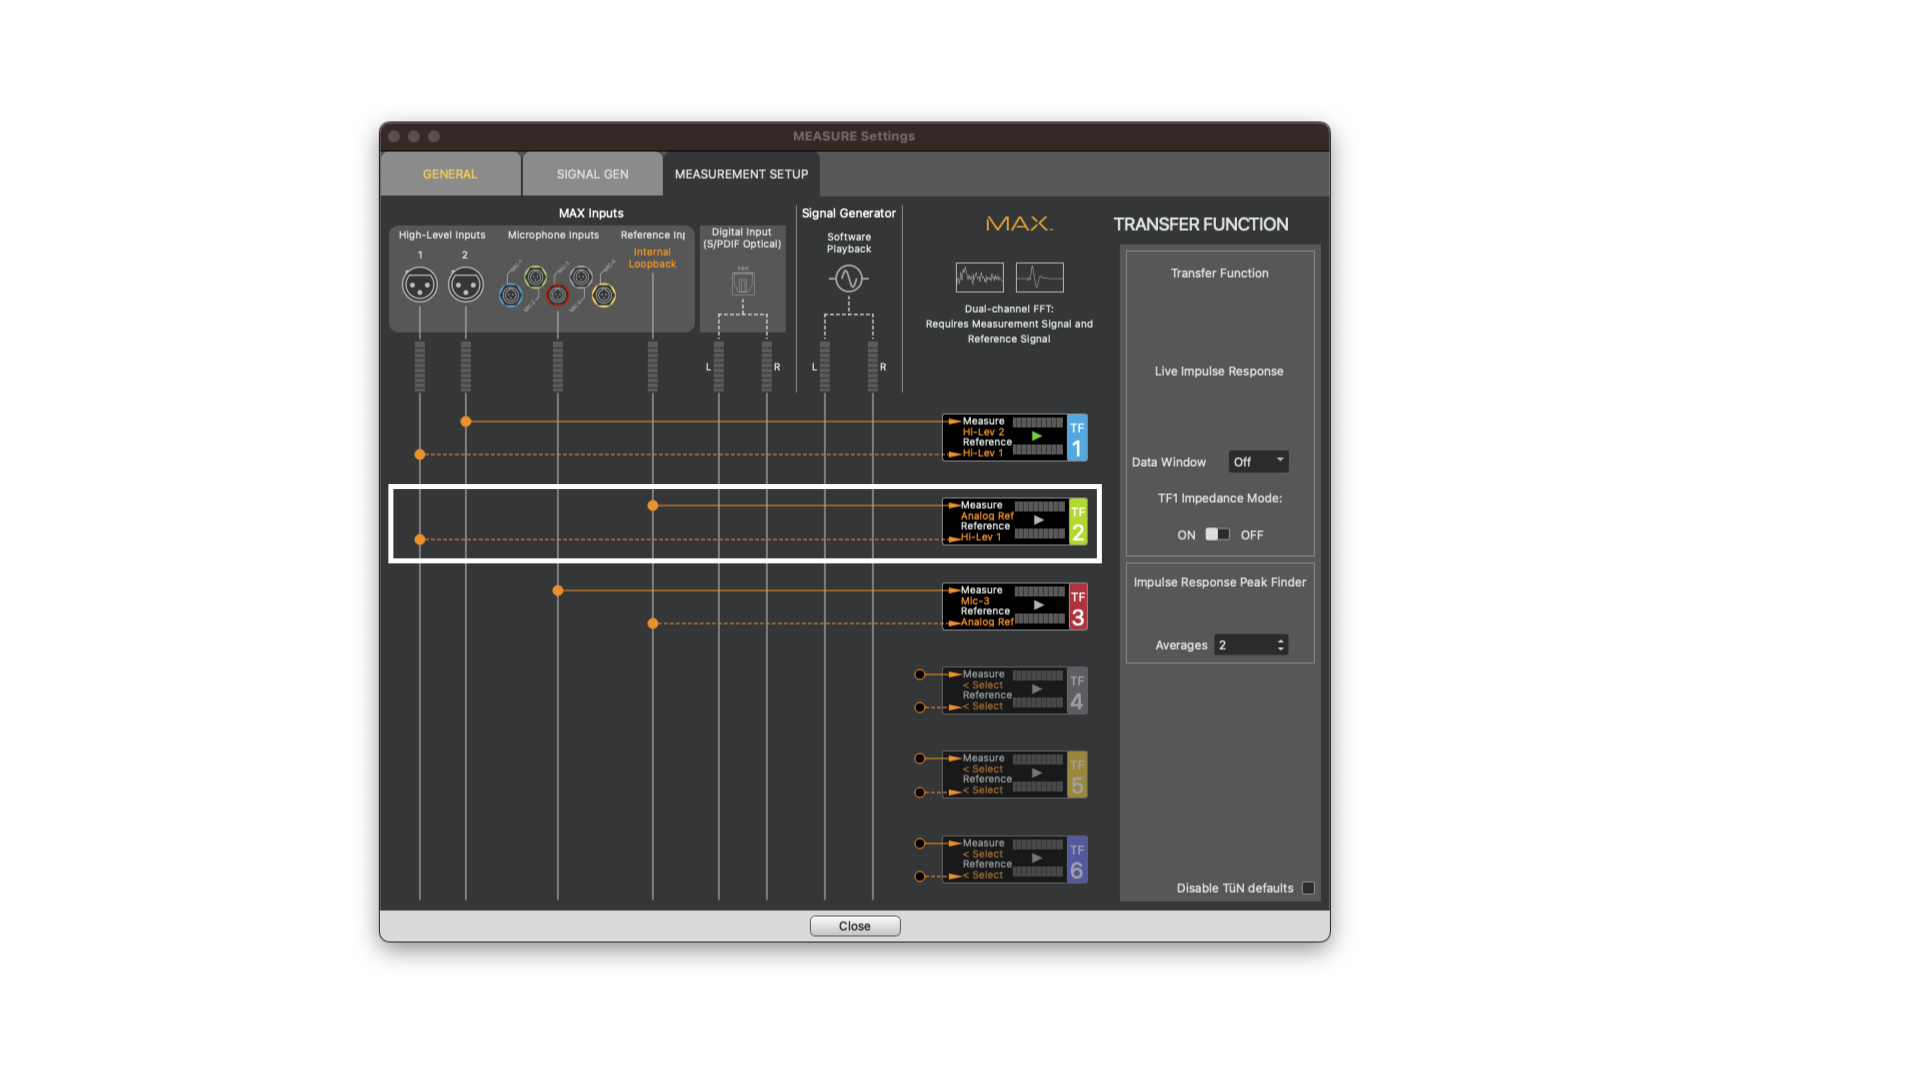
Image shows Transfer Function Engine 2 routed for external voltage sense
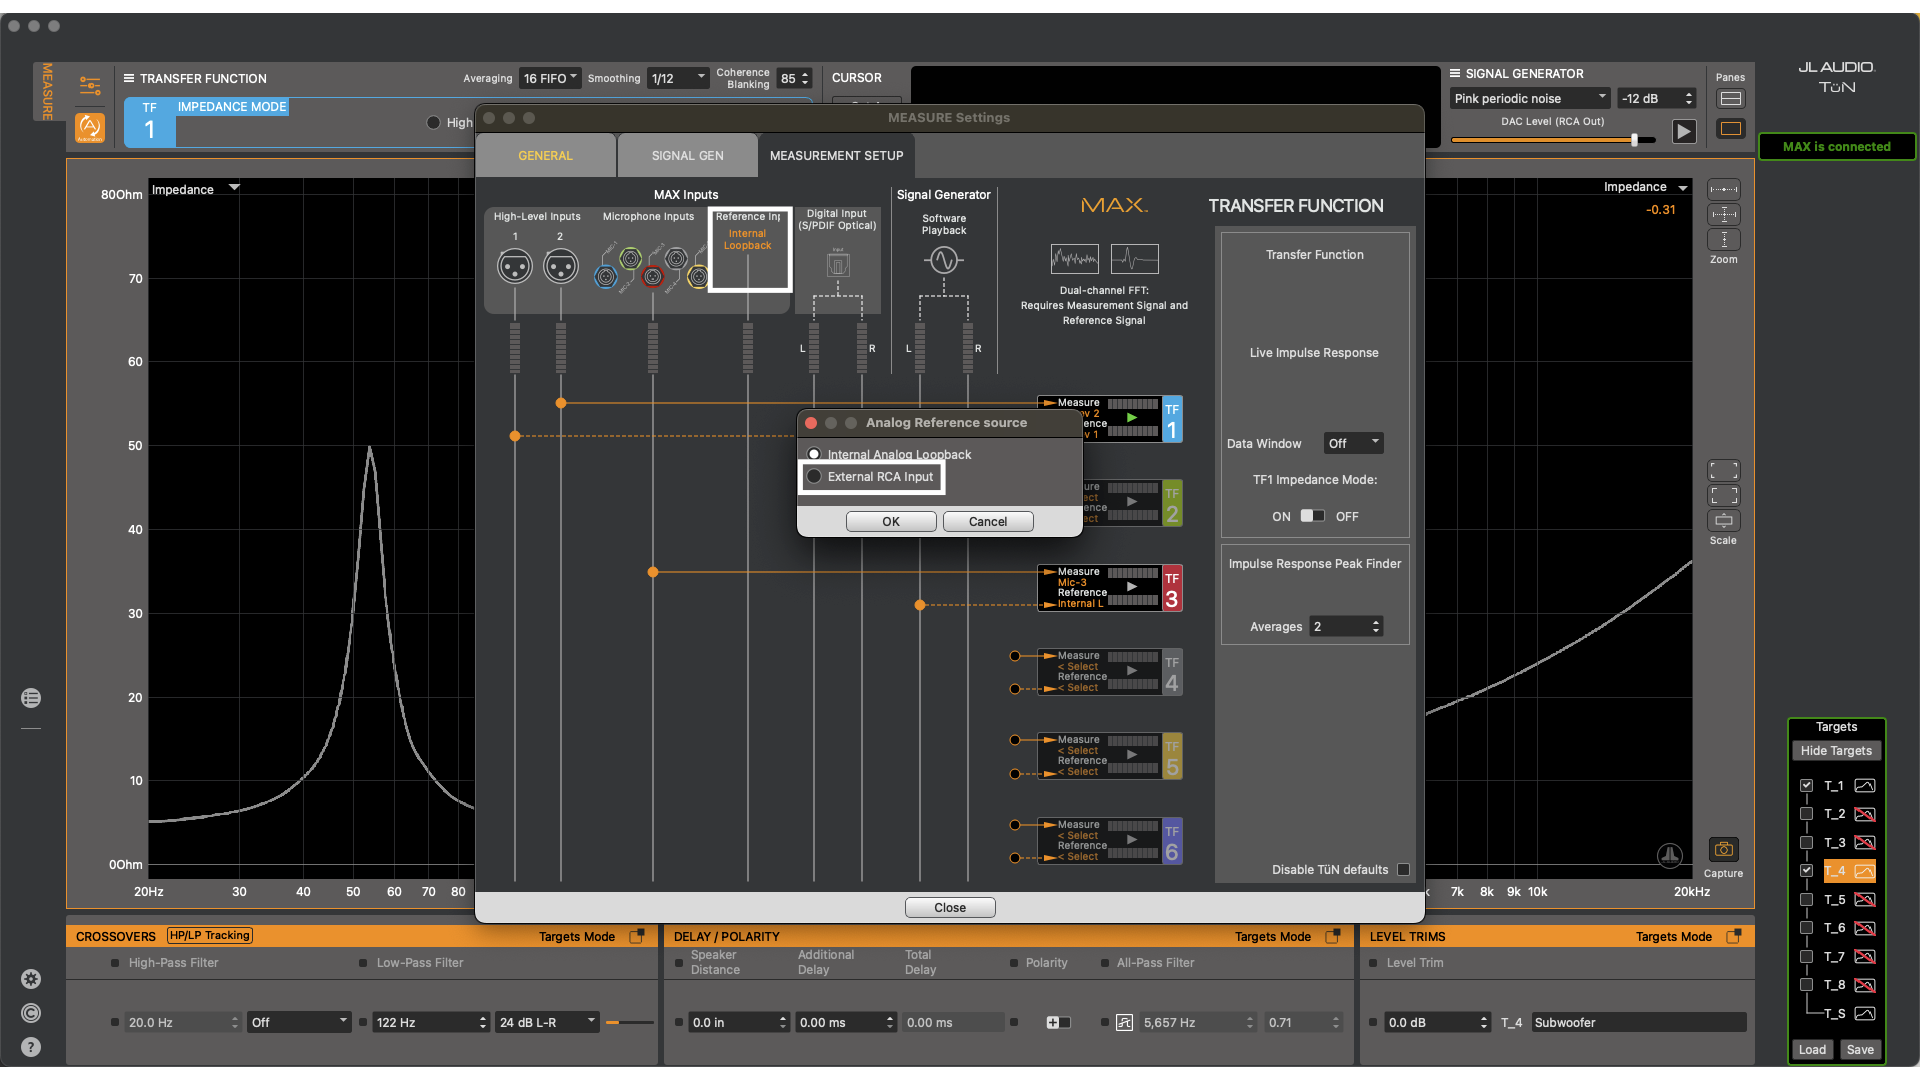
Image shows changing Reference Input from Internal Analog Loopback to External RCA Input
This makes it possible to measure the voltage directly at the speaker as it fluctuates providing a more accurate measurement. This is because as current flows through the TRS cables, a small amount of voltage drop occurs. This voltage drop is what causes the 2 wire measurement to be less accurate. This is more easily visible on a higher frequency speaker like a tweeter. To calibrate the new TF Engine, connect both the TRS alligator probes and new test cable’s alligator probes to the resistor at the same time. In TüN™ software, calibrate the new TF Engine the same way as TF1, by removing gross adjustments in the Meters & Gains panel then small adjustments in the Input Combo Box. At this point, simply remove the resistor and replace it with the speaker. Viewing phase of the new TF Engine will plot the timing relationship of voltage versus current.
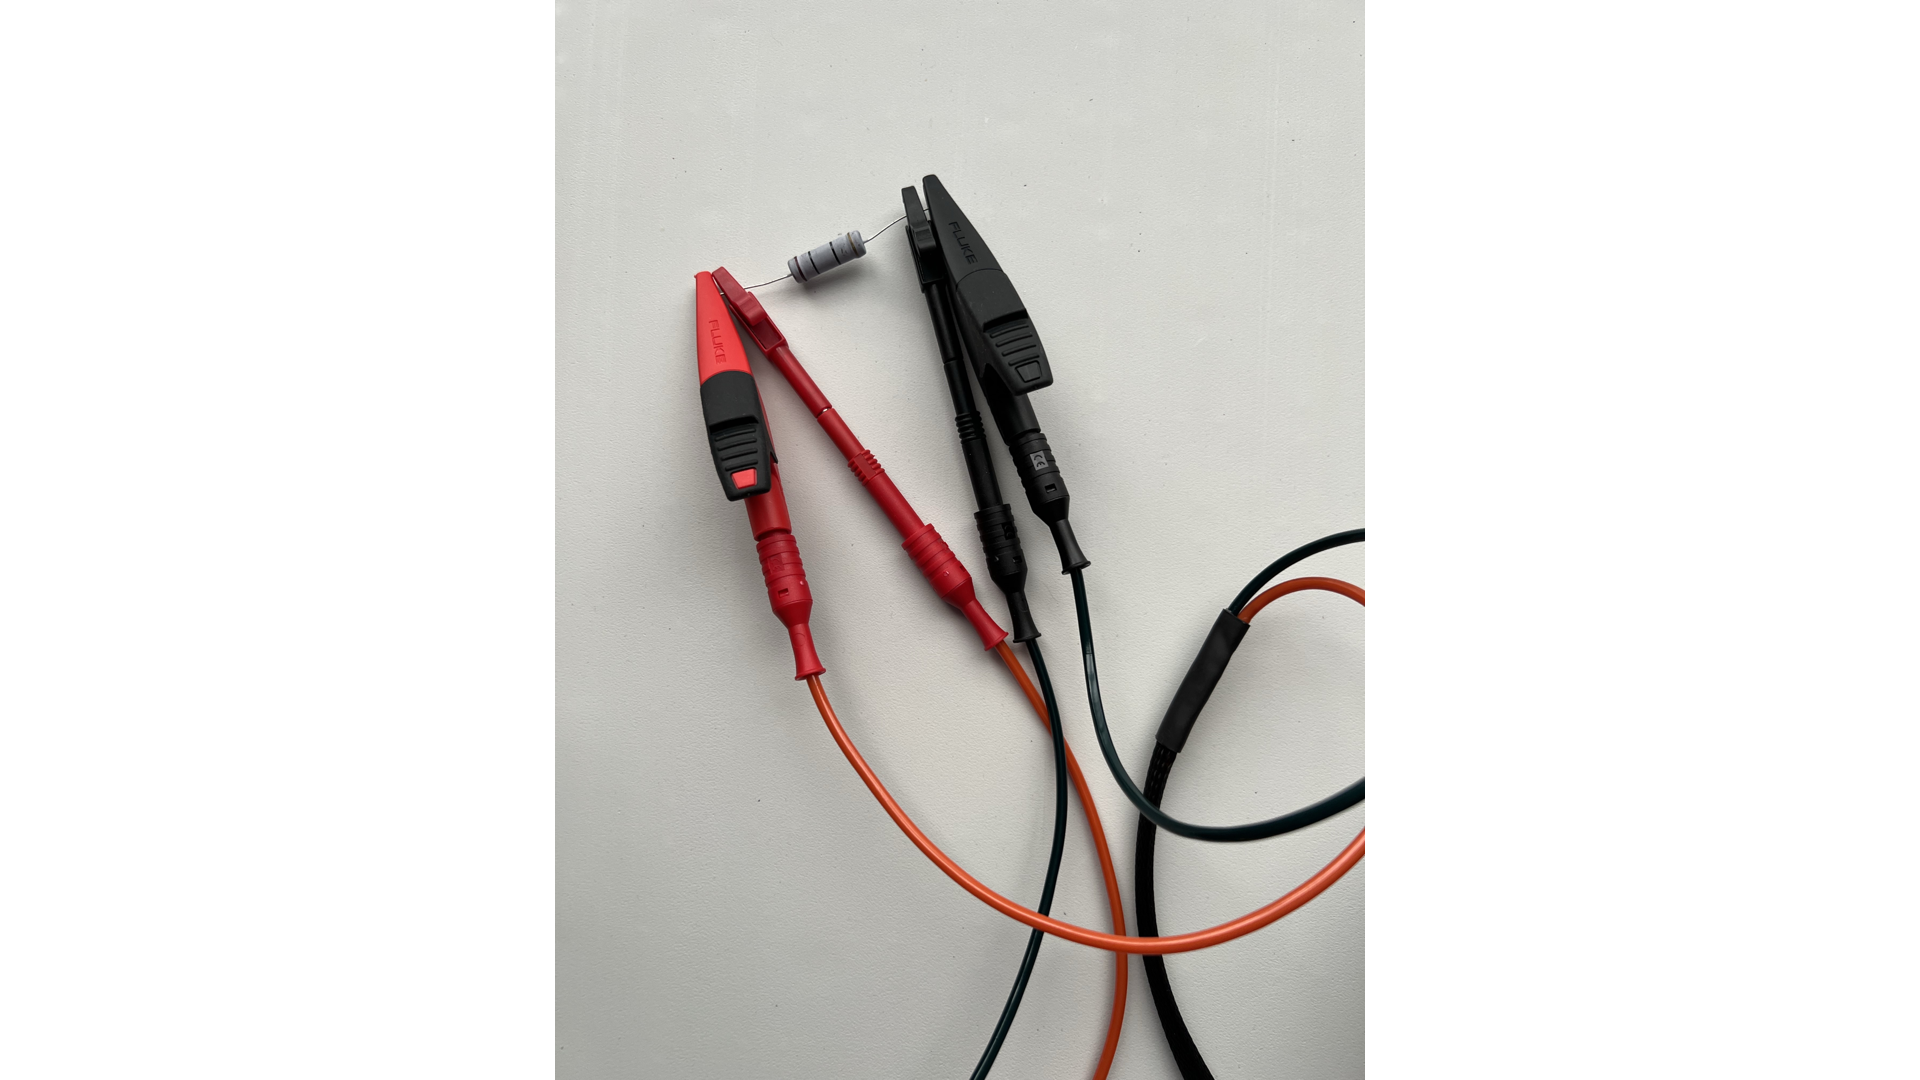
Image shows both TRS probe and RCA probe connected to 10 ohm resistor
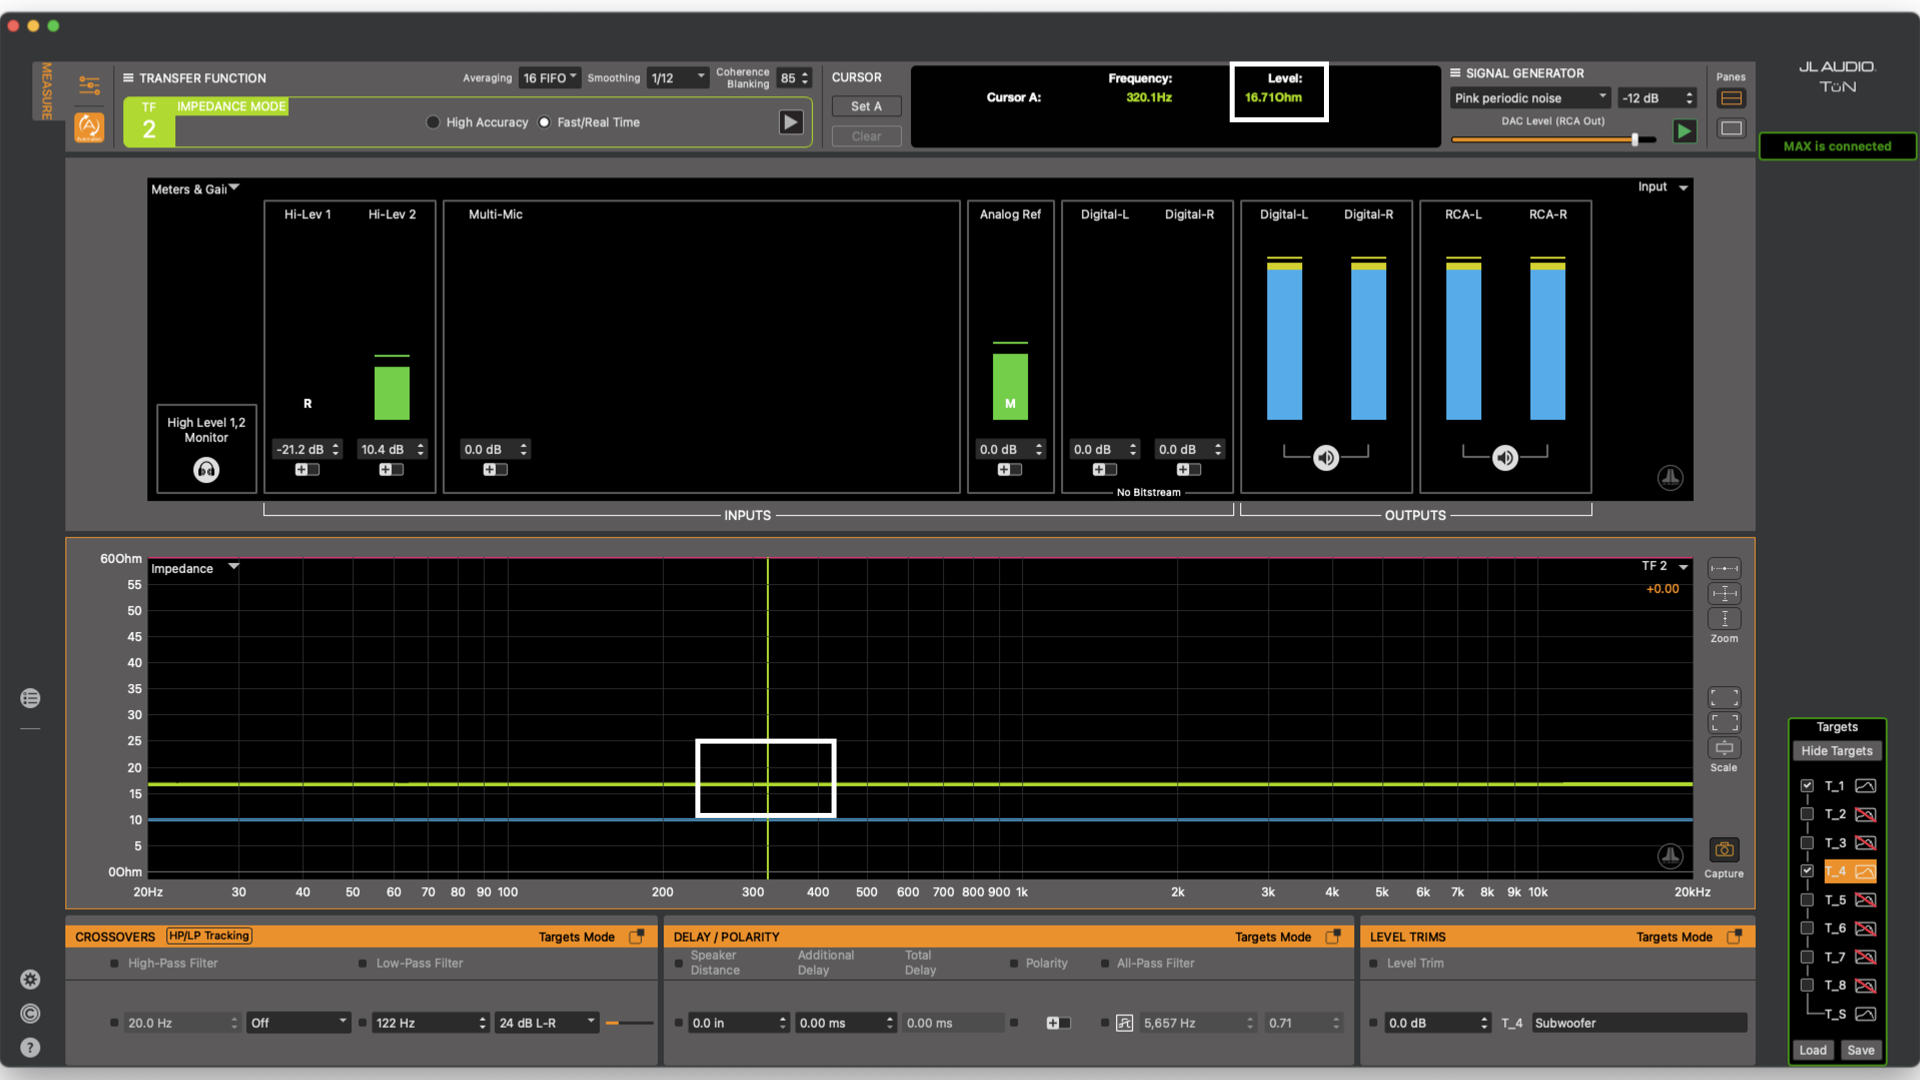
Image shows values for the cursor position in the information display
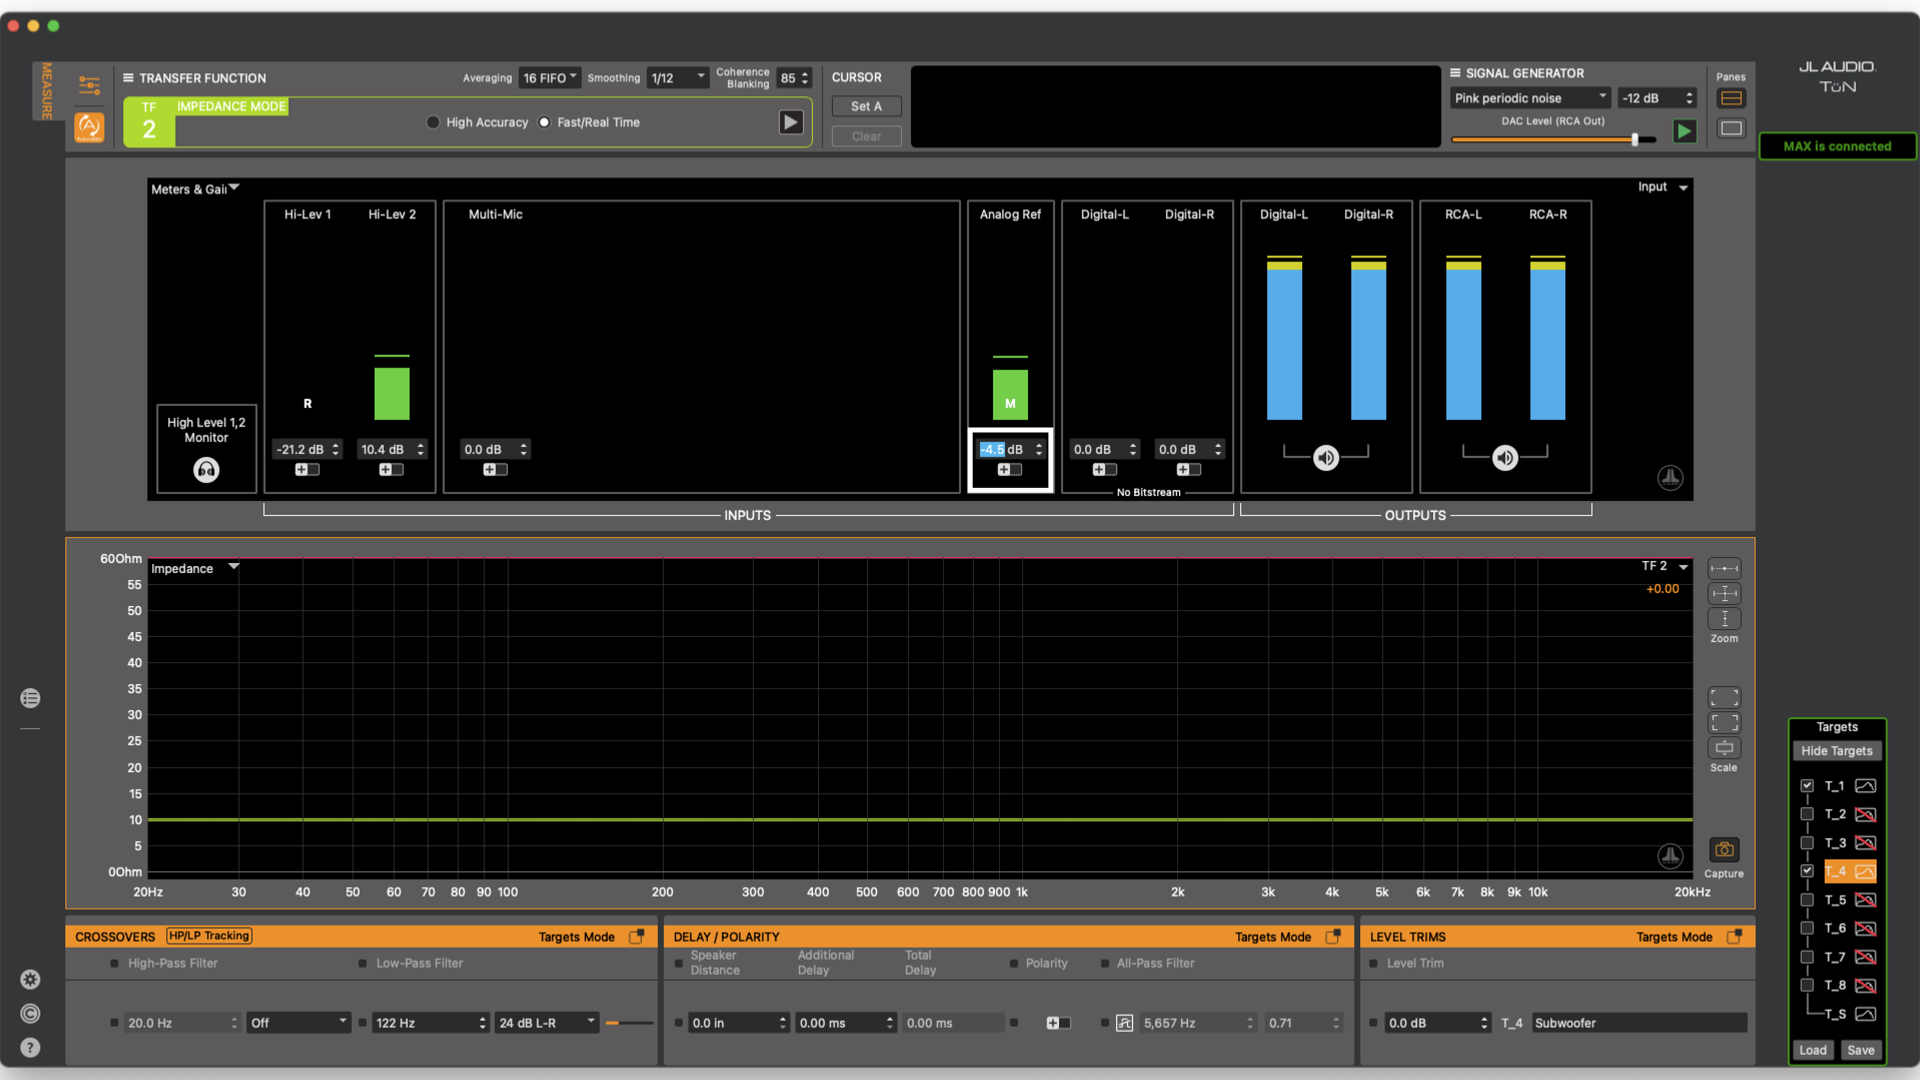
Image shows Analog Reference gain being adjusted to close to 10 ohms
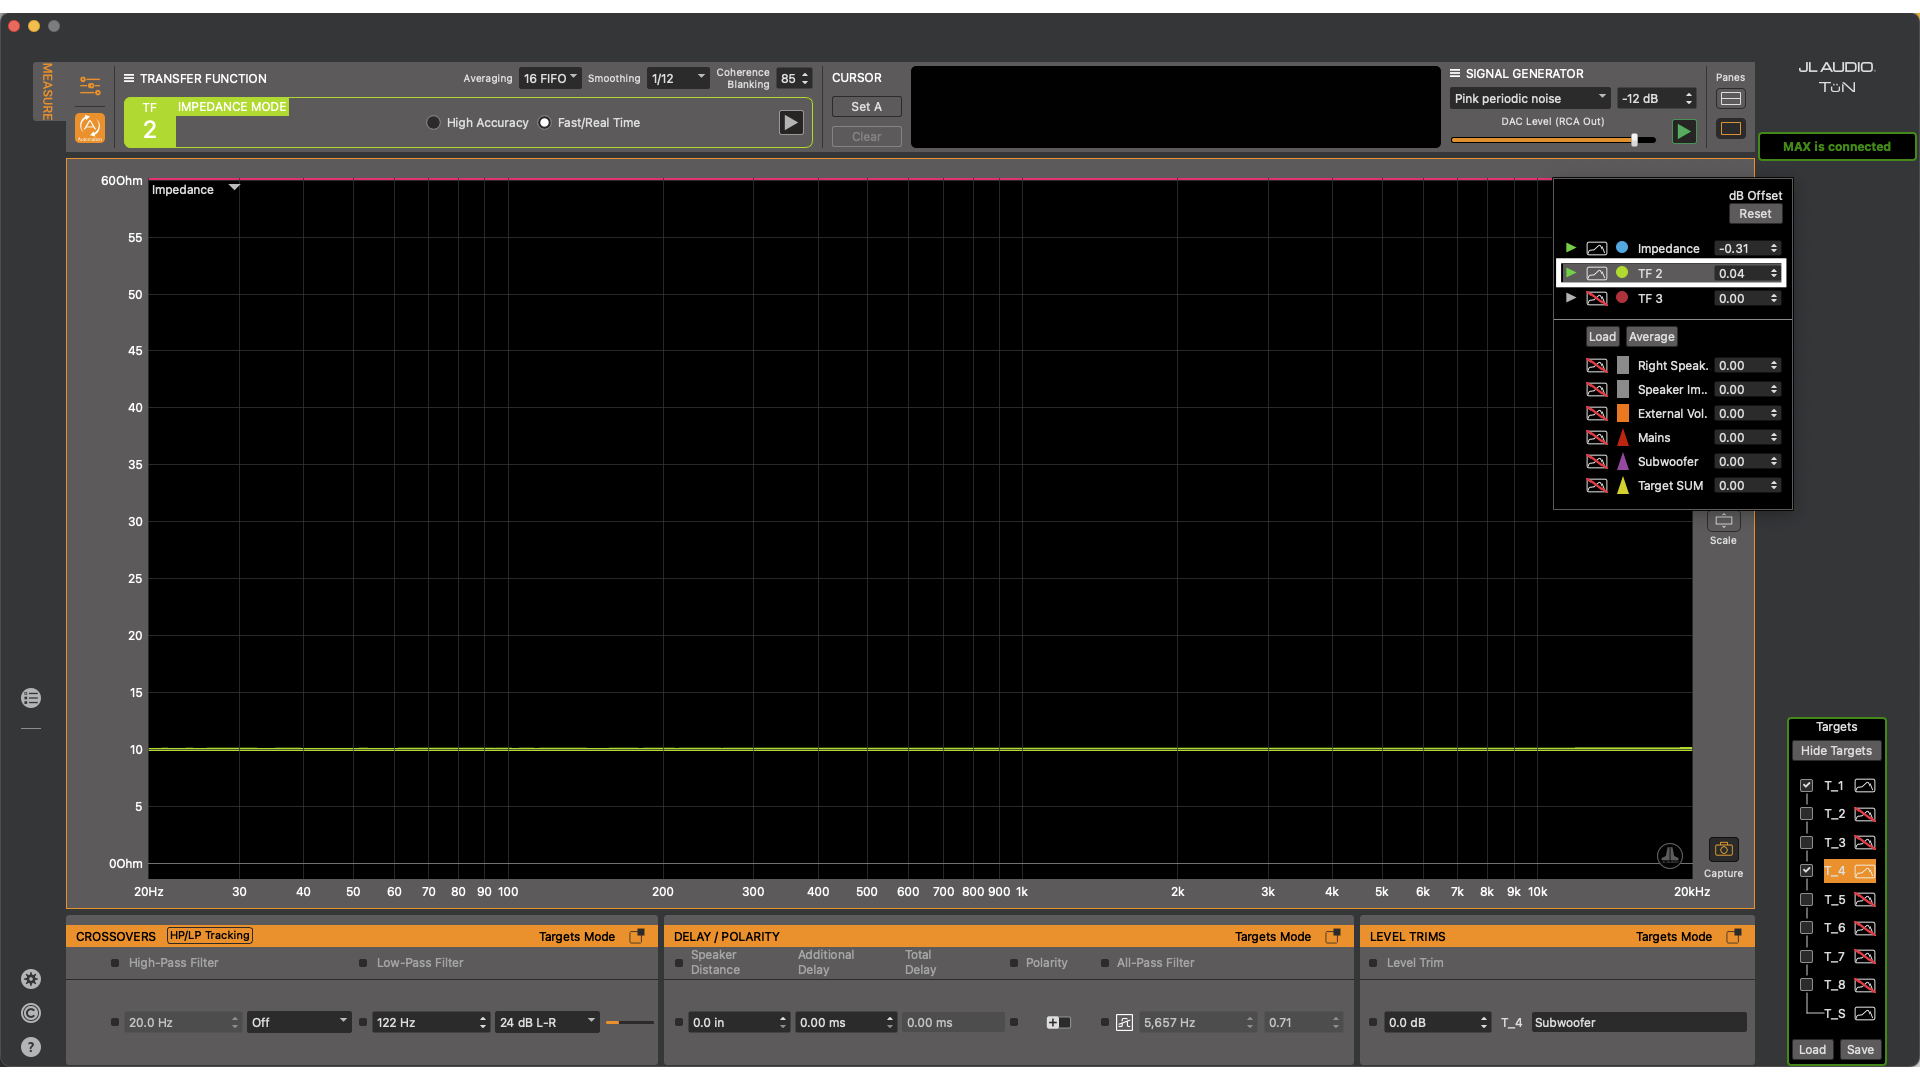
Image shows fine tuning TF2 to get it as close to 10 ohms as possible
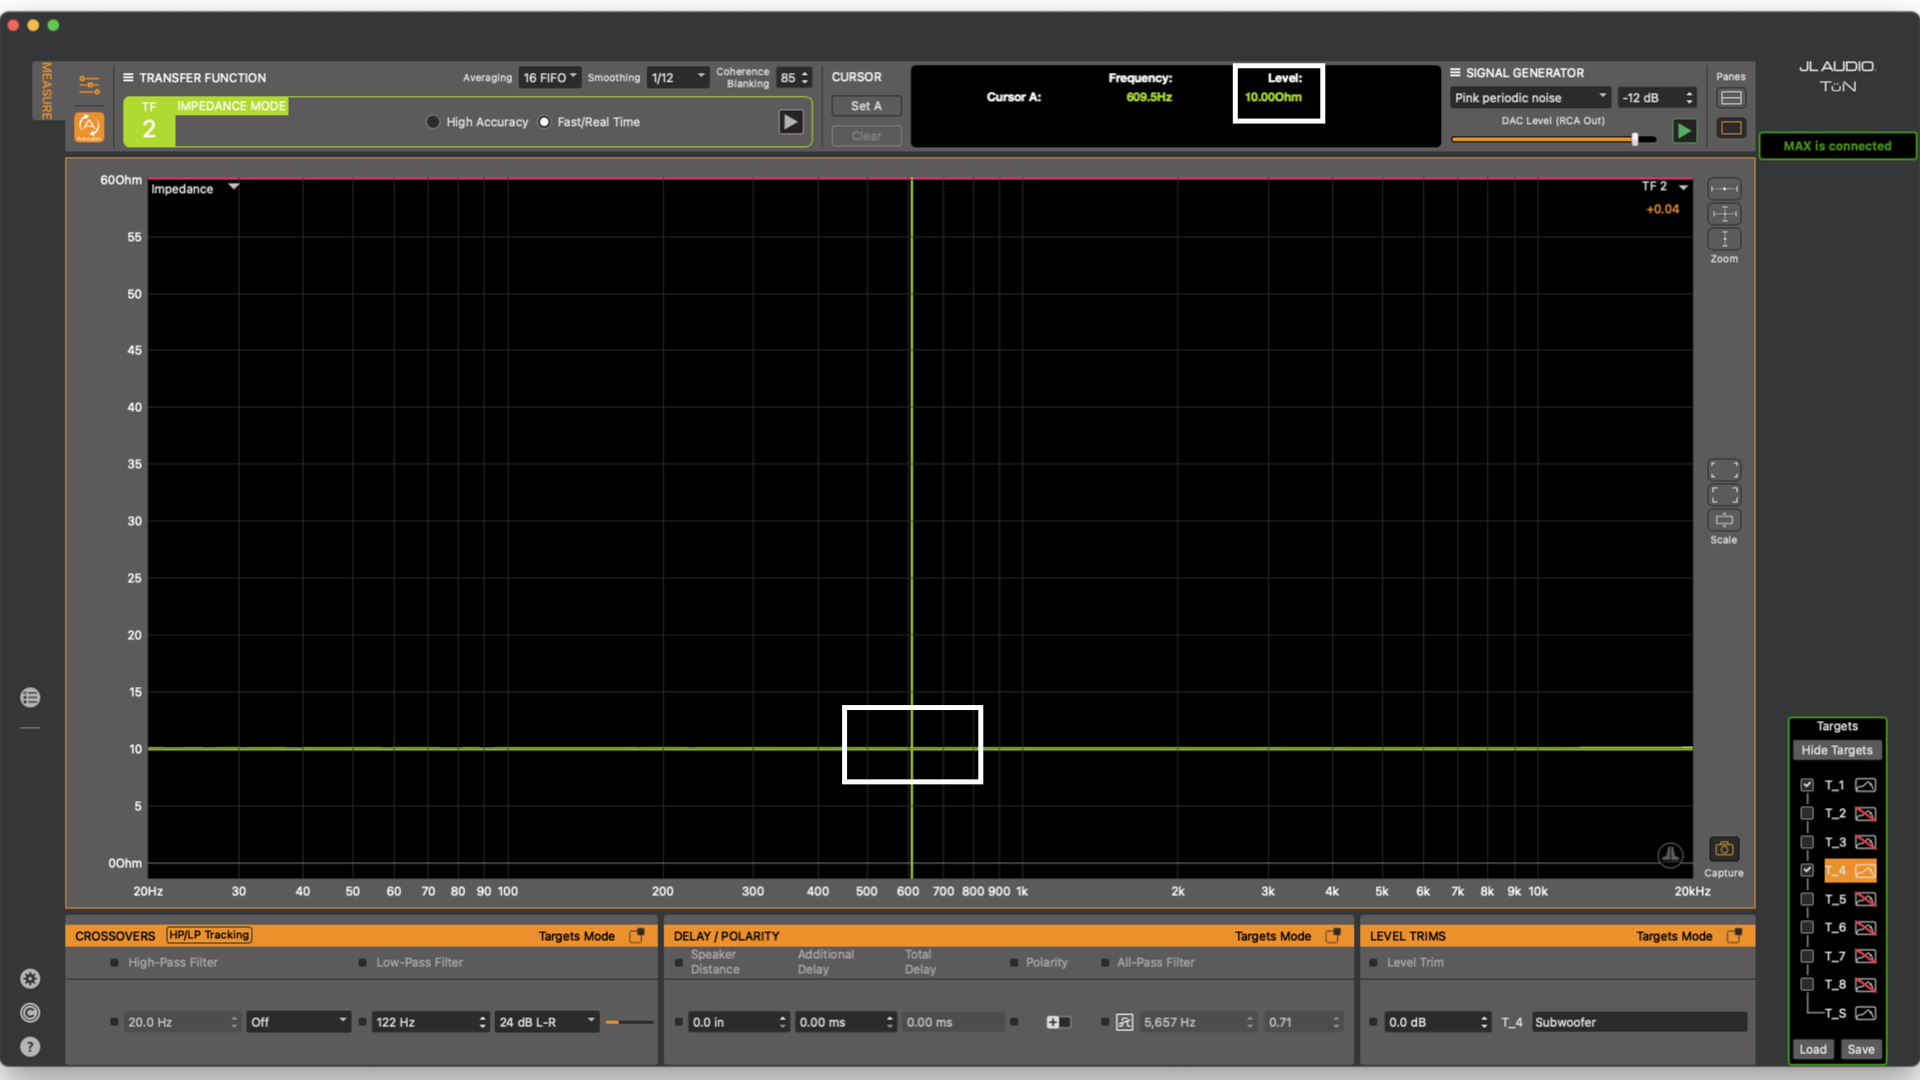
Image shows values for the cursor position in the information display
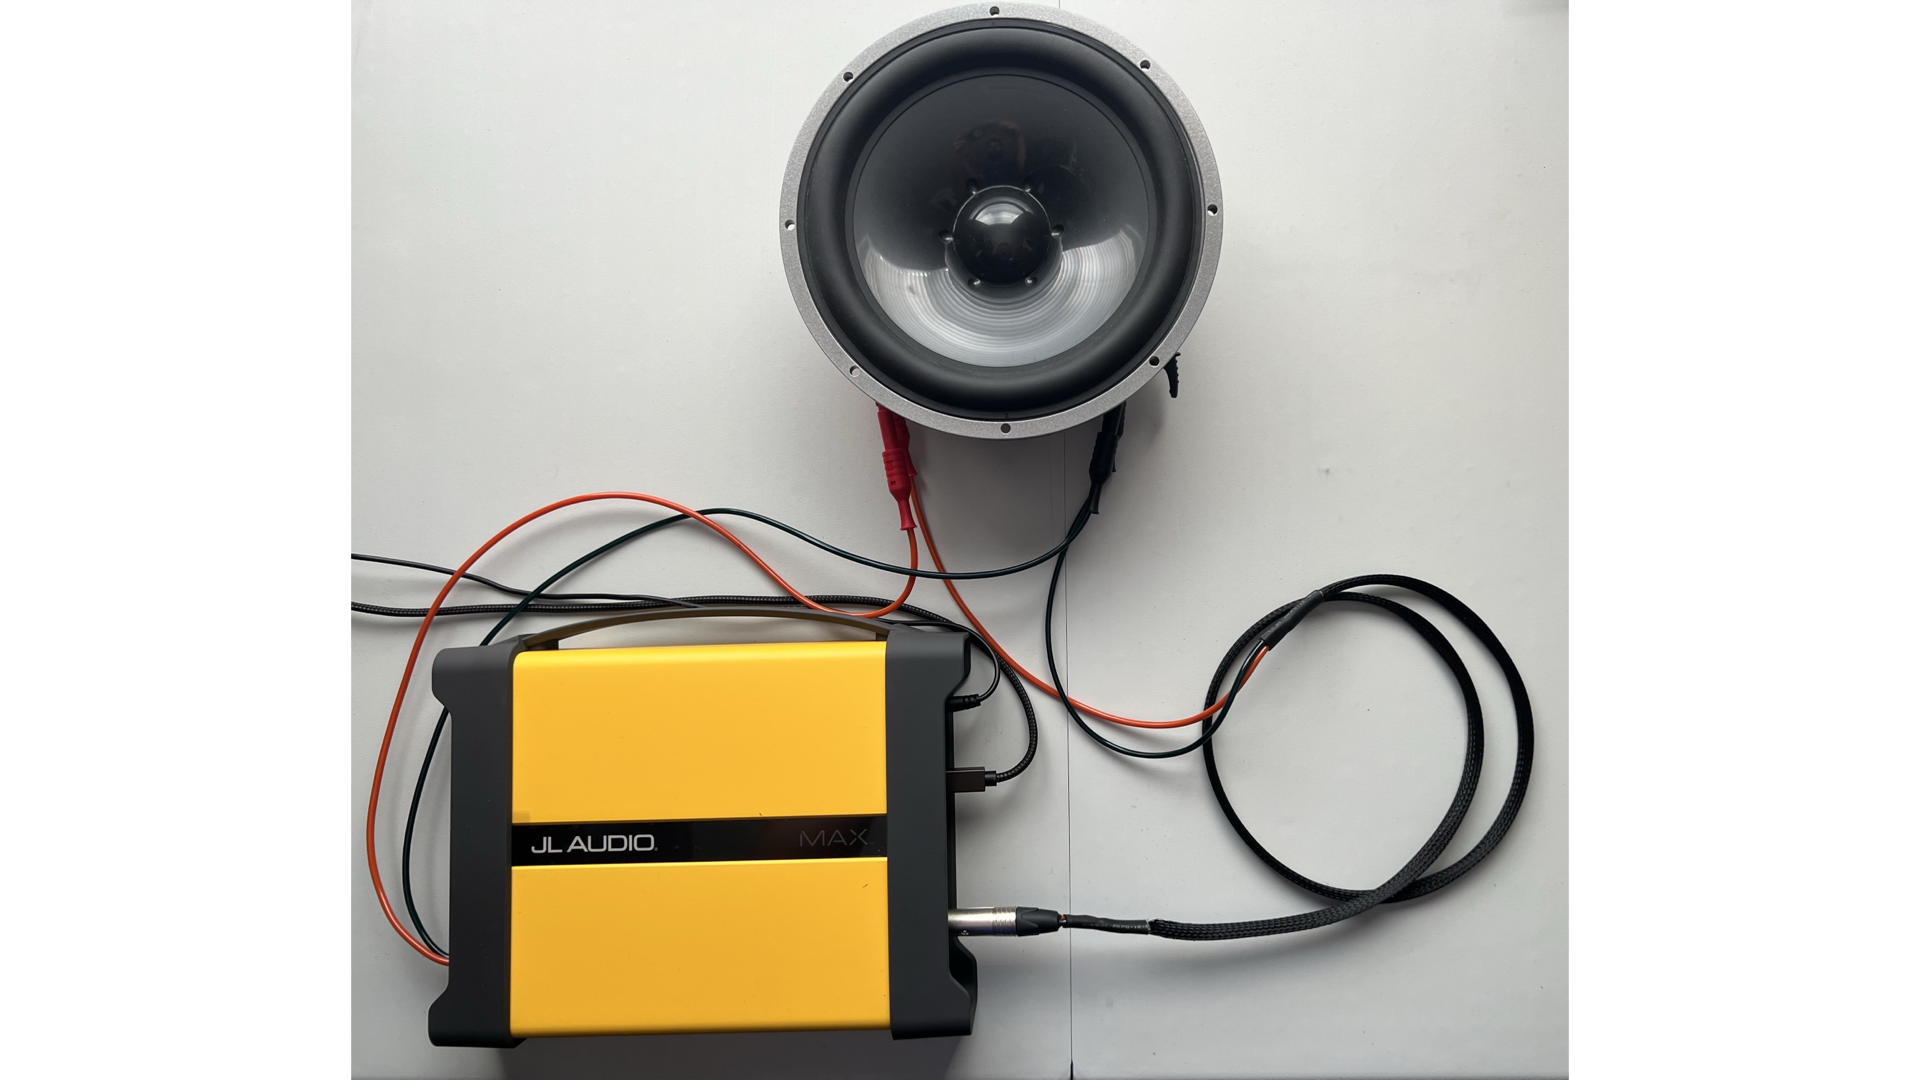
Image shows both TRS probe and RCA probe connected to a speaker
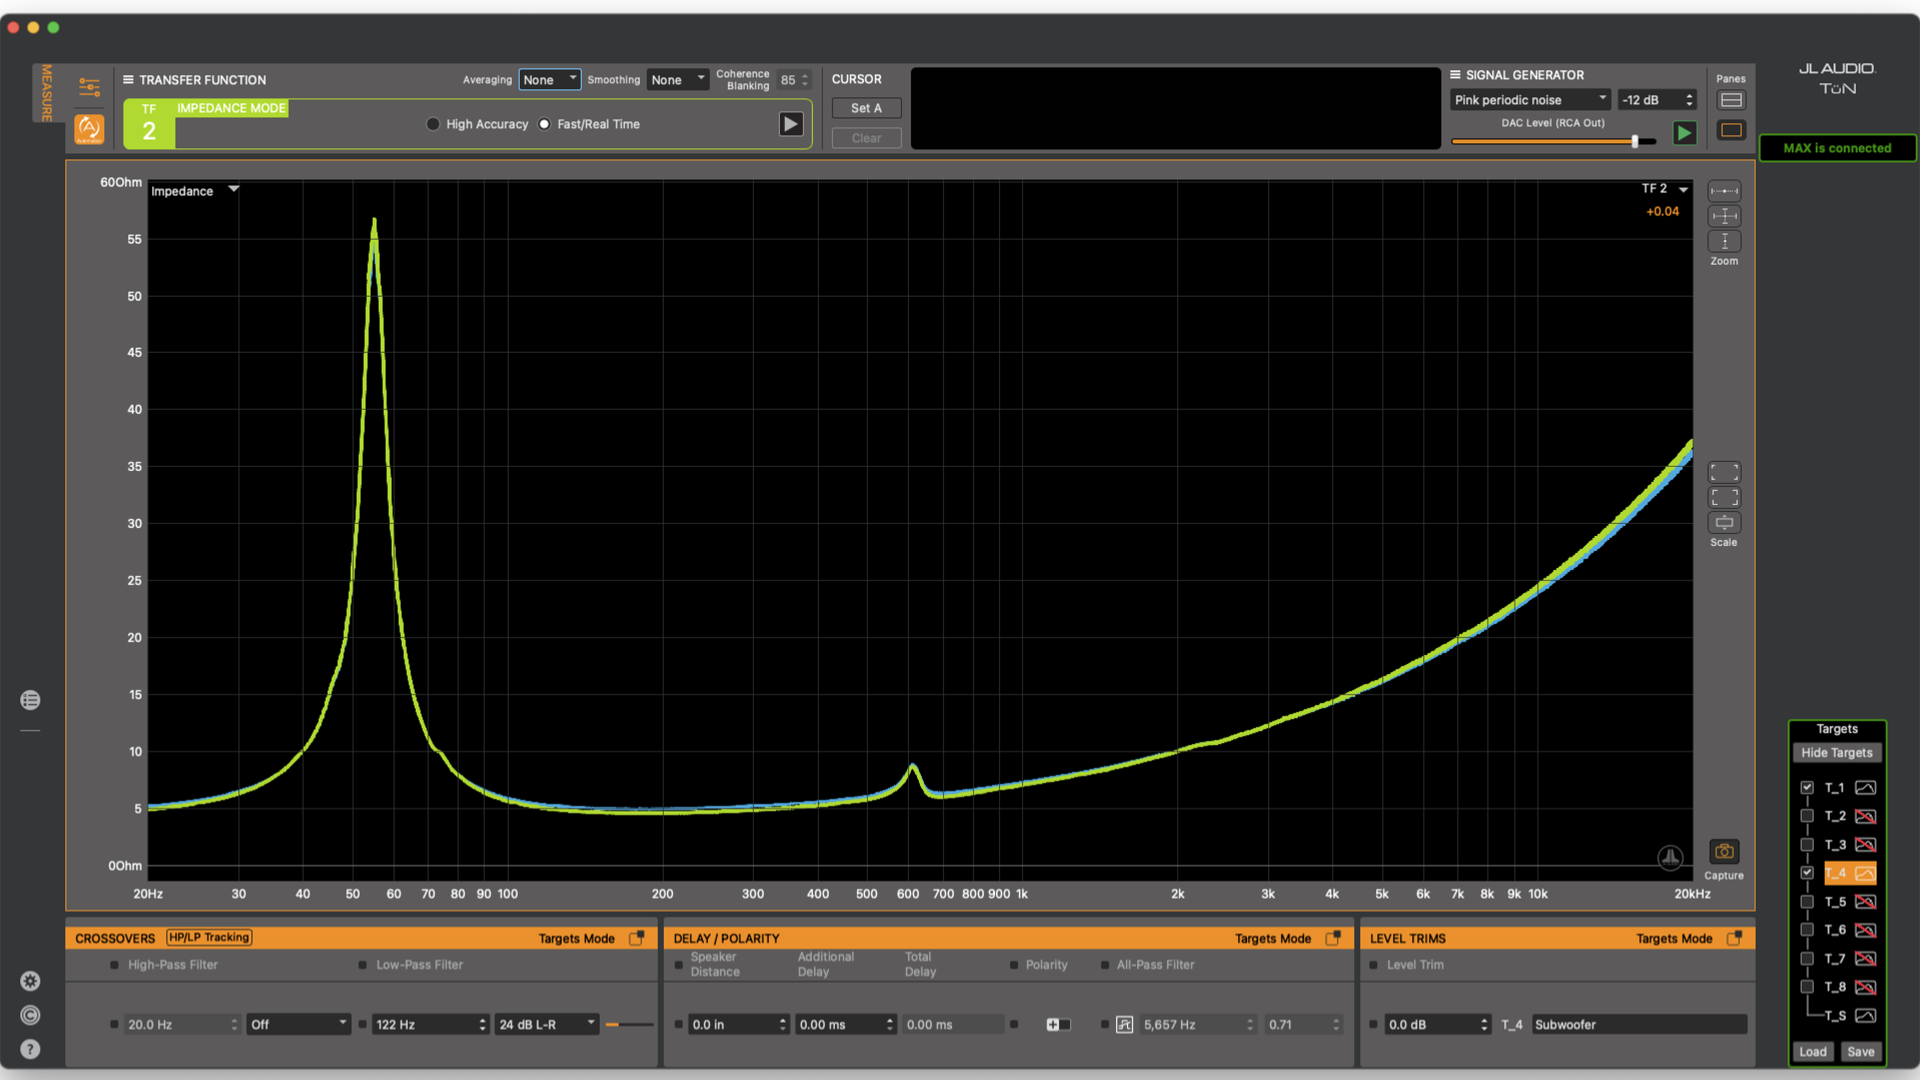
Image shows overlay of internal voltage sense and external voltage sense methods
In the other two methods of 4-wire impedance measurements, both current and voltage are measured externally. For example, if there was a large subwoofer connected to an amplifier, a current measuring device could be connected around the subwoofer wires. The other method requires the use of a current shunt in line with the subwoofer to measure the voltage drop across the shunt. TF1 Impedance mode would not be used for this setup. If more information about these methods are desired, reach out to the JL Audio Training Department at training@jlaudio.com
This is just the beginning of taking electrical measurements with MAX and there is far more possible but hopefully this provides some insight into getting started with electrical and Impedance measurements.